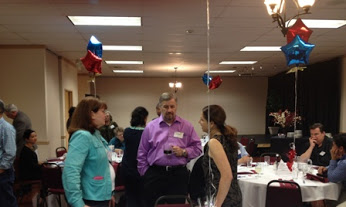
Ben Vaught, from the Washington State Office of the CIO, and I had the pleasure of presenting at the state’s Office of Financial Management’s Fall Forum last week, held over two days at the Thurston County Fairgrounds in Olympia.
Ben talked about the use of visual processes as part of the Washington Business One Stop initiative he has been working on for a while, and towards the end of his talk he showed some pictures of the WIKISPEED garage in Lynnwood, where I first met Ben and Michael DeAngelo, Deputy CIO for the state.
My talk was supposed to have been on Visual Management in government and administrative processes, but seeing pictures of the old WIKISPEED garage, which used to be covered with stickies on all walls (including the massive garage doors!) before the team adopted Kerika to knit together their global community of volunteers, was a wonderful throwback moment!
When it came to my turn, in addition to showing the use of Kerika for cross-agency GIS projects, such as those led by Joy Paulus, I was also able to show examples of Kerika in use by Sherri Hrubi, Danica Ersland and Melissa Wideman, who all work together in OFM’s HR Division.
Several other people presented, including Irene Hill and her design team from the Department of Licensing, Howard Cox from the Department of Enterprise Services, and Eric Gardner from OFM’s Forecasting Division.
Our newest update to Kerika serves up a rather long list of changes; the two big areas for improvement were:
We have updated our integration with Google Apps Marketplace to use OAuth 2.0, since Google is retiring its OAuth 1.0 implementation.
We have made a bunch of improvements for using Kerika on iPads, with the Safari or Chrome browsers. (We still need to work on Android tablets, which, unfortunately, present too much variety…)
The OAuth 2.0 upgrade and iPad improvements are described in previous posts; here we want to highlight some of the other changes and improvements we made with this new version:
We have changed the way colors show on cards, on Task Boards and Scrum Boards to make them more usable:
In addition to being less distracting, this new design will enable us to expand the palette of colors we can offer: the old design restricted us to only the lighter pastel colors.
New styling for colored cards
We have redesigned our “Max Canvas” view so that it provides the most useful display, when you need the most space available to view a large board. In particular, you can now access Search even when you are in the Max Canvas view.We have improved security, by implementing secure cookies.
We added some subtle animation effects to improve usability. (So subtle, in fact, that you might not even notice them if you are an existing Kerika user, which is just what we want.)
In terms of infrastructure and other under-the-hood improvements, we have expanded our use of JUnit automated tests and done a bunch of bugs fixes, as usual.
There’s a lot of improvements being done on Kerika, and at a very fast rate. Make sure you subscribe to our blog to keep up!
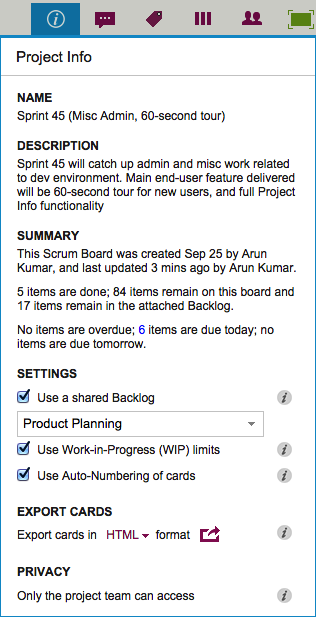
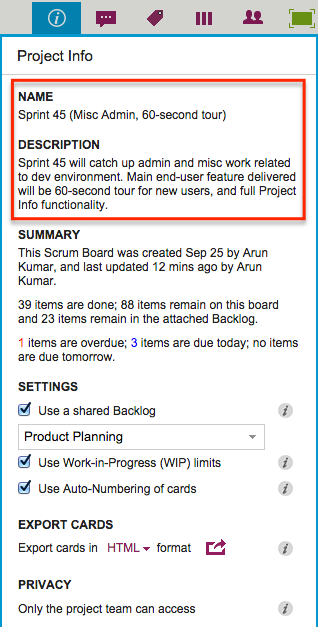
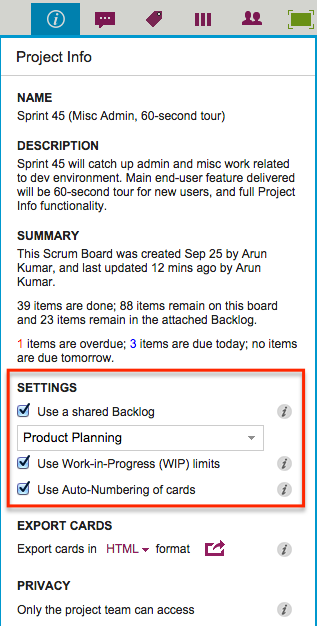
There are several sections in here: at the top is the Name and Description of the project:
Name and Description
The Description is a new attribute of Kerika’s boards: it lets you provide context about the project that can help orient new team members, and it can also help with your Searches in the future.
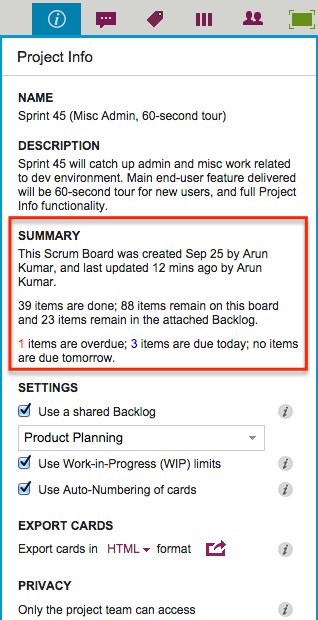
It tells you when the board was first created, and by whom.
It tells you when the board was last updated, and by whom.
And for Task Boards and Scrum Boards it tells you how many cards are done, and how many remain.
Since each card typically represents a work item, this is a quick way to find out how much work remains on a board, without having to count up all the cards in each column.
For Task Boards and Scrum Boards, this view also shows you how many cards are due today, due tomorrow, and overdue.
And for Scrum Boards, it shows you how many cards are in the Backlog that you are using, so you get a sense for how far along you are with the overall project, not just the current Sprint.
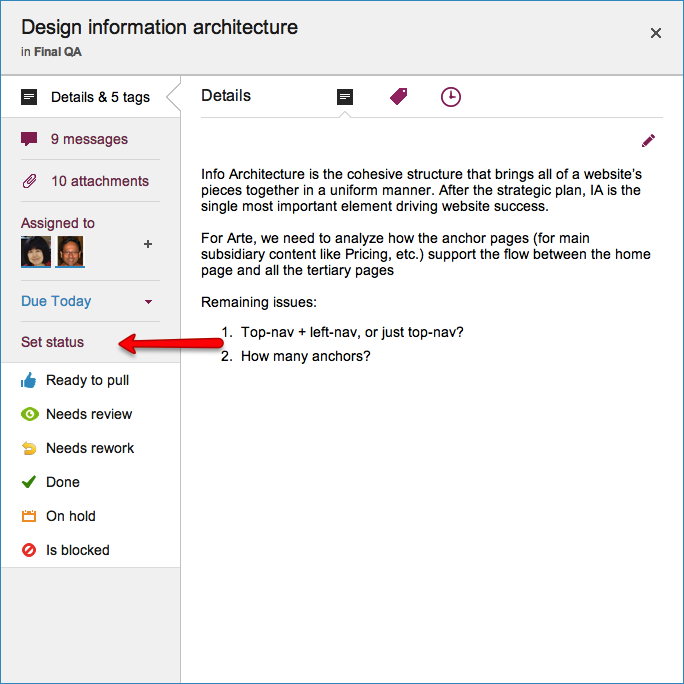
All Kerika Task Boards and Scrum Boards now have support for Work-In-Progress Limits: these can be turned on or off by the Project Leader or Account Owner:
Task Boards and Scrum Boards also have a new auto-numbering feature that can help you manage very large boards, e.g. if you are using Kerika for an internal Help Desk.
Arun Kumar, Kerika’s CEO, will present at the Washington State Office of Financial Management (OFM) Fall Forum, at 1:30PM on September 17, 2014 at the Thurston County Fairgrounds in Olympia, Washington.
The topic will be experimentation with Visual Management in government and administrative processes.
Arun Kumar, Kerika’s CEO, will present a special Breakout Session on One team, many places: creating collaboration networks for distributed workgroups
The vision of Lean Government is about collaborating across offices, across agencies, and even across sectors. In an era of flat or even declining budgets, it’s become essential to get Lean across the state, not just across the room.
The old technologies never really supported distributed Lean and Agile, but that’s all changed now: a new generation of browser-based work management tools makes it fast and easy to build Lean and Agile teams that connect professionals across agencies, and across sectors so that expertise from the private sector, academia, and nonprofits can be leveraged to deliver great results in Washington.
This breakout session will feature a look at some great cross-agency projects and cross-sector projects: initiatives that have succeeded in delivering in a way that was unimaginable only a couple of years ago.
The session will be presented at 12:15PM in Room 318 on October 21, and again at 10AM in Room 318 on October 22.
If you are working in state, county or local city government and are interested in Lean and Agile, be sure to join us: the cost for attending is just one can of food, which will be donated to a food bank :-)
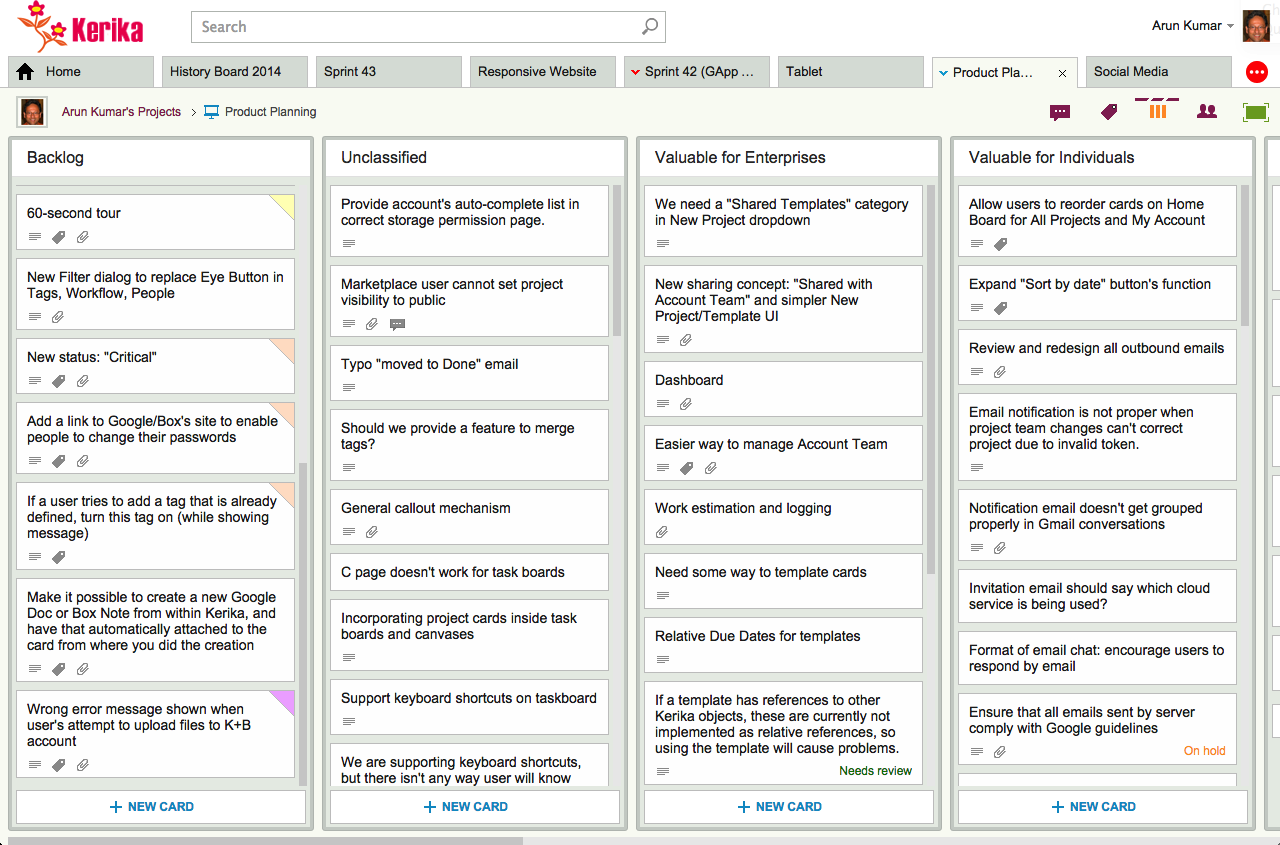
Kerika’s Task Boards are so easy to set up and use that teams sometimes make the mistake of sticking everything on the same board, week after week and month after month, until the board becomes really too big to be useful.
The Kerika software itself doesn’t buckle under the weight of hundreds of cards on a single board (and, to be honest, we are also guilty of sometimes doing very large Scrum iterations that turned over a few hundred cards -.-), but just because the software works fine doesn’t mean the practice makes sense.
The most common way for a Kanban board to get overcrowded is for it to be used for too long: the Done column gets bigger and bigger, as more work gets completed each week, until you end up with a very lop-sided looking board with perhaps 20-50 items in “To Do”, and maybe 1,000 items in “Done”.
When presented with a board that contains hundreds or even thousands of items in Done, it’s hard for individual team members to get visual satisfaction from seeing cards move over to the Done column on a regular basis: as work gets done, it seems to vanish into this endless pile of other work that’s already been done.
Teams and, especially, Project Leaders should not underestimate the value of this visual satisfaction of seeing a well-balanced board, with about the same number of items in “To Do” (or Backlog, or Pending, or whatever you choose to call your parking lot) and in the “Done” column, with an even-looking distribution of items in the columns in the middle.
(The simplest Kanban board may just have three columns: To Do, Doing, and Done, but Kerika makes it easy to have far more complex workflows, and to capture your organizations’ best practices as a collection of process templates.)
If a Kanban board is going to be used for an extended period, say several months or more, then we recommend create a parallel History Board that can be used to track the historical achievements and progress of the team. Here’s how this scheme works:
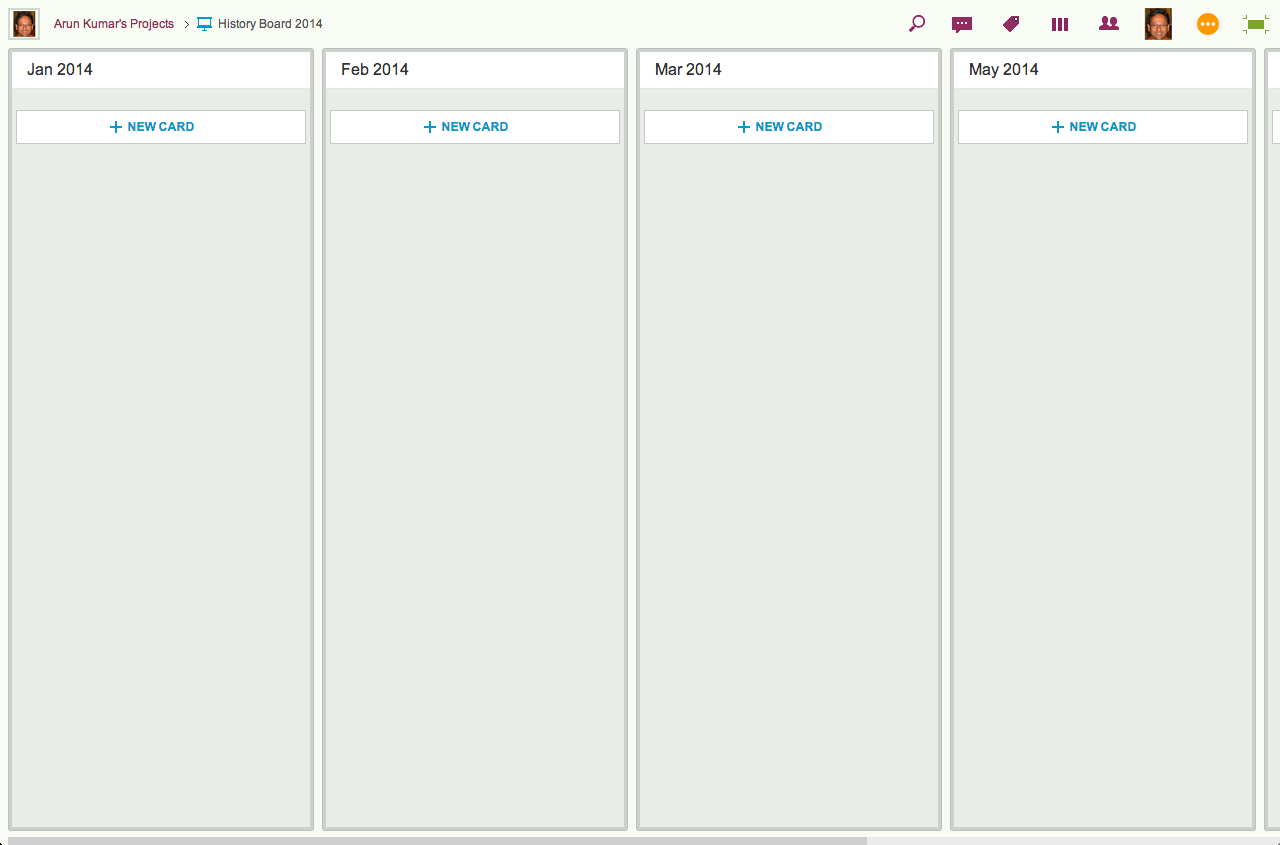
Create a board called “History Board 2014”. (The name isn’t particularly important.)
Organize this boards with columns that look like this: Jan 2014, Feb 2014, Mar 2014…
An example of a History Board
We will use these columns to hold all the cards that were completed in that particular month. So, for example, the Jan 2014 column would contain everything that was completed in January 2014.
At the end of every month, pause for a moment to celebrate your team’s accomplishments for that month. (Order in some beer and pizza and maybe pause for longer than a moment…)
Move all the items that in Done onto the History Board: use Kerika’s cut-and-paste feature, which will let you move a bunch of cards intact, along with their history, chat, attachments, etc., from the Done column of your main Kanban board to the appropriate column in your History Board.
Laptop users will find their right-mouse click menu handy for this: click on a card in the Done column, do “Select All” from the right-mouse menu, and then do a “Cut”. Once you have cut (or copied) anything into your Kerika Clipboard, a Paste button will automatically appear at the top of each column, on each board where you can make changes.
So, Cut from Done on your active board, go over to your History Board, and then do click on the Paste button at the top of the appropriate column, e.g. the August 2014 column.
This simple method lets you achieve two objectives at the same time:
It’s an easy way to trim the size of your active Kanban board: by taking out the “Done” stuff each month you can stop it from ballooning in size over time.
It’s an easy way to create a comprehensive historical view of everything your team has achieved over time: go over to the History Board and you can see how work got done over an entire year. (Might be useful at performance review time ;-)
A side-benefit: your active Kanban board will load a lot faster if it doesn’t get overloaded.
Another note from a user which we wanted to share with you…
Just this week we had a fundraising administrative group meeting where our people collected for a 4-day meeting.
One of my software developers attended the meeting and we were scheduled to do a 1.5 hour presentation in the last slot of the 3rd day at 3 PM.
At 11 AM that morning, while he was in the meeting, I created a Kerika project for our presentation. I added the cards and attached screen shots and links that I wanted to present.
I messaged him in the meeting to get him to add cards to the project for IT issues that had been discussed in the previous 2.5 days so that we could address them in our session.
While he added cards, I added more screen shots to his cards and we organized and combined the cards while being in separate rooms so that by the time 3 PM rolled around, I showed up for the meeting and we did our presentation together.
It was ‘very agile’ indeed.
It probably wasn’t as polished as a PowerPoint but it was a lot more relevant as we put it together so quickly.
While we presented the different topics, we swiped the cards through the ‘Active’ and into the ‘Done’ column.
As we neared the end of our time limit, we were then able to adjust on the fly the topics that we would present with the time we had left.
Of course, we didn’t finish but it allowed us to present the most meaningful information with the time we had.
One of our users wrote in last night with this great story, which we wanted to share with you…
I did a one hour webinar for the software company (Software AG) that we develop all of our software with as they were impressed with the way we were using their software development environment (NaturalOne).
I threw a little Kerika spice into my presentation as it has become such an important part of our development environment and I actually used it to prepare my presentation.
Instead of preparing the presentation by myself I used a Kerika project and had my software developers contribute cards and instructions in the areas that they specialized.
While I was doing a live presentation I was referring to the cards on my other monitor and swiping them to the ‘Done’ column as I completed them.
I know you like to hear stories about how people use your software and this worked very well for this presentation. It was recorded and I will send you a link to it once it is published. It might put you to sleep at night, except for the Kerika part.
“Done” is where you want to get to: it’s a special column that’s always to the right edge of every Task Board and Scrum Board.
(You can always chose to hide the Done column, of course, just like you can hide every other column on the board.)
Marking a card as “Done” is simply a quick way of moving it to the Done column, which can be handy when you have a very elaborate workflow — and we have seen folks whose boards have up to 20 columns!
In the near future when we add Work-In-Progress (WIP) Limits for Task Boards and Scrum Boards, the Done column, of course, will not be subject to WIP.
We are also planning on adding more metrics to help Project Leaders and Account Owners understand how well their projects are going, and these will naturally make use of the Done count.