Category Archives: Technology

Posts related to technology in general.

A great new Search feature

We updated Kerika today with a great new Search feature that lets you find anything you want, across every card, canvas and project board, across your entire Kerika world!

There’s a short (1:13) video to our YouTube channel that provides a good overview:

Search works across your entire Kerika world: every project board and template to which you have access. This includes projects where you are part of the team, of course, but it also includes public projects created by other folks, like the Foundation for Common Good in the UK, and the transnational WIKISPEED project.

Basic Search will work for most people, most of the time, but we have also built a very powerful Advanced Search feature that lets you zoom in any card on any board or template, using a variety of criteria.

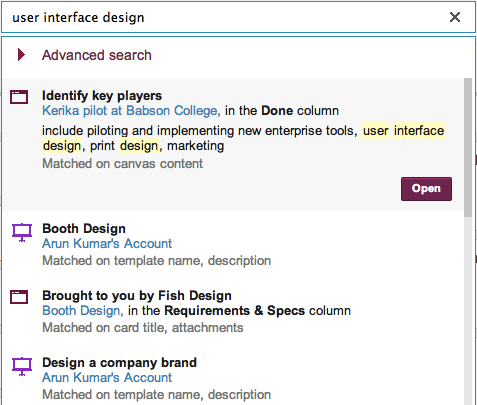
Here’s an example of Basic Search:

Example of basic search

The most likely (top-ranked) item is shown at the top of the list, and is automatically selected so that you can quickly go to it if you are feeling lucky 😉

For each item that matched your search, Kerika provides a ton of useful metadata:

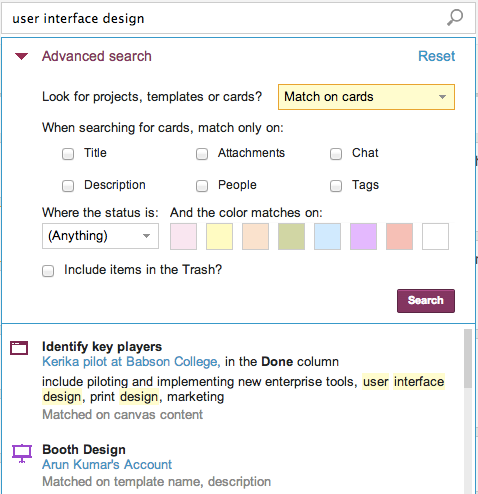
  • It tells you the name of the card, project or template that matched. (In the example above, it is Identify key players.)
  • If the match was on a card, it tells you the name of the project (or template) board on which the card is located, and the name of the column where the card is located. (In the example above, it is Kerika pilot at Babson College.)
  • It shows a small snippet of the search match, so you can decide whether it is what you were looking for.
  • It even tells you what attribute (aspect) of the card matched your search. (In the example above, the card matched on some text within a canvas that was attached to the card.)

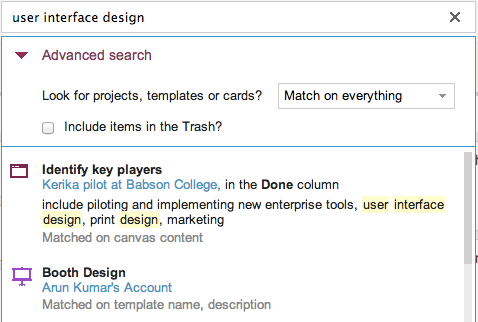
If you want to really zoom in on a particular piece of information, use the Advanced Search feature:

Accessing Advanced Search

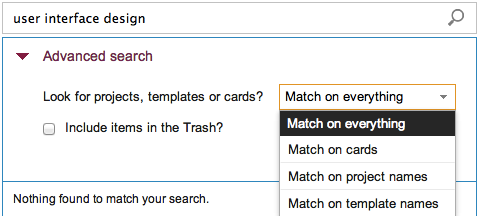
The first step towards zooming in is to narrow your search, by focusing on project names, template names, or individual cards:

Accessing Advanced Search
Focusing your Advanced Search

If you are searching for specific cards, you can further narrow your search to focus on titles, descriptions, chat, attachments, people, status, color, and tags:

Options for searching for cards

Searching by different aspects (or facets) can give very different results, as this composite of three searches shows (click on image to enlarge):

Searching by facets
Searching by facets (Click to enlarge)

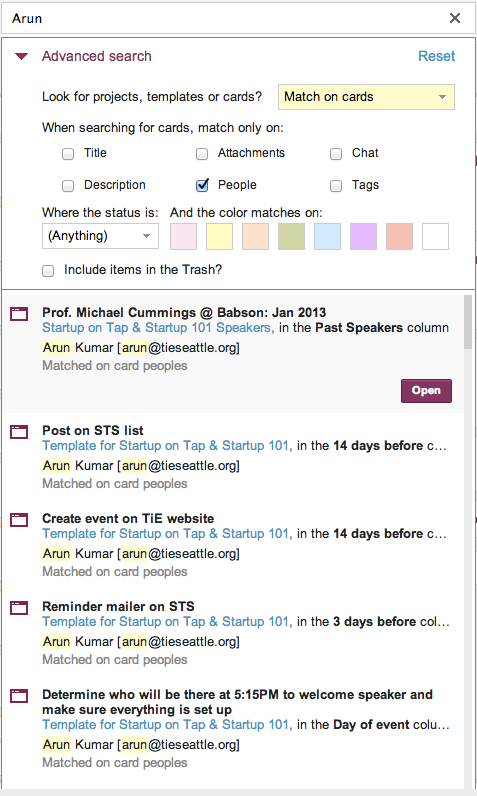
Other options include searching by people; here, for example, we are trying to find all the cards that are assigned to a specific person:

Searching for People

Any combination of facets is possible: for example, you could search for all cards assigned to someone that are waiting for review.

So, that’s Search in Kerika, the only task board designed specially for distributed teams!


Identifying bottlenecks is easier with visual task boards

One great advantage of a visual task board like Kerika is that it is a really fast and easy way to identify bottlenecks in your workflow, far better than relying upon burndown charts.

Here are a couple of real-life examples:

Release 33 and Release 34 are both Scrum iterations, known as “Sprints”.

How Scrum works
How Scrum works

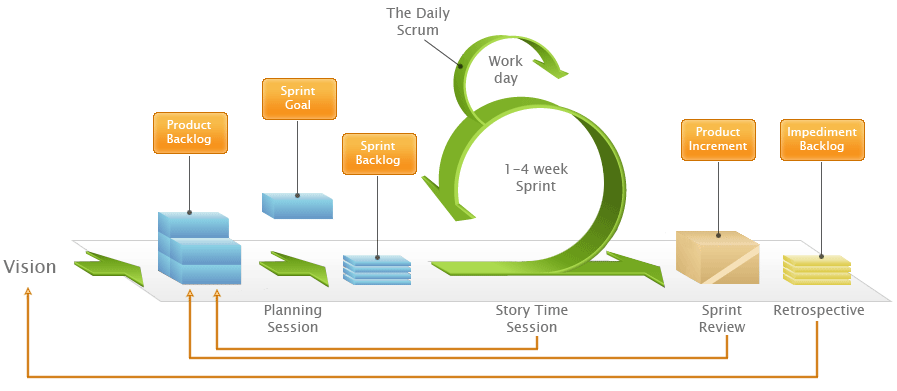
Both iterations take work items from a shared Backlog – which, by the way, is really easy to set up with Kerika, unlike with some other task boards 😉 And for folks not familiar with Scrum, here’s a handy way to understand how Scrum iterations progressively get through a backlog of work items:

We could rely upon burndown charts to track progress, but the visual nature of Kerika makes it easy to identify where the bottlenecks are:

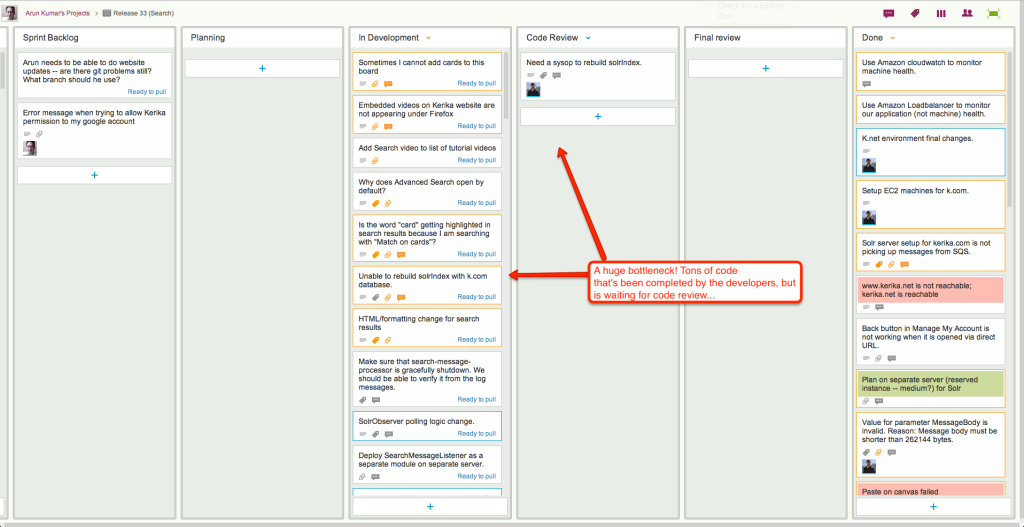
In Release 33, the bottleneck is obviously within the Development phase of the project:

Release 33: a bottleneck in Development

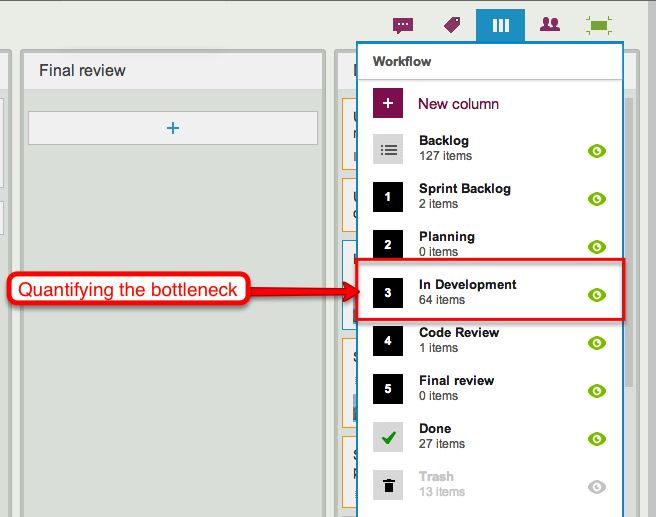
When we take a look at the Workflow display, it’s easy to quantify the problem:

Quantifying the bottleneck in Release 33

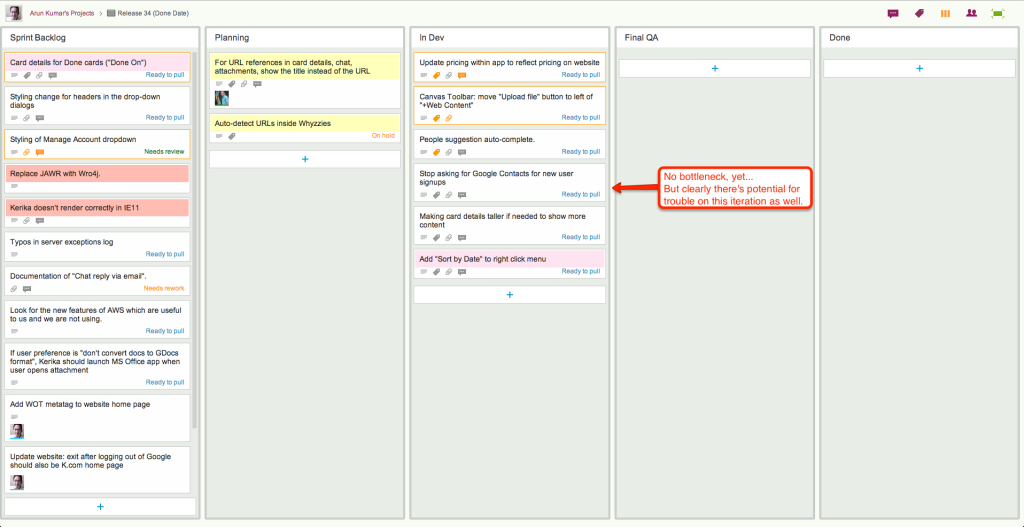
By way of contrast, here’s Release 34, another Scrum iteration that’s working off the same Backlog:

Release 34: a smaller bottleneck

This iteration doesn’t have the same bottleneck as Release 33, but warning signs are clear: if we can’t get our code reviews done fast enough, this version, too, will have a develop a crunch as more development gets completed but ends up waiting for code reviews.

In both cases, Kerika makes it easy to see at a glance where the bottleneck is, and that’s a critical advantage of visual task boards over traditional Scrum tools.

Our use of data stores and databases

A question we are asked fairly often: where exactly is my Kerika data stored?

The answer: some of it is in Amazon Web Services, some of it is in your Google Drive.

Here are the details: your Kerika world consists of a bunch of data, some of which relate to your account or identity, and some relate to specific projects and templates.

Your account information includes:

  • Your name and email address: these are stored in a MySQL database on an Amazon EC2 virtual server.Note: this isn’t a private server (that’s something we are working on for the future!); instead, access is tightly controlled by a system of permissions or Access Control Lists.
  • Your photo and personalized account logo, if you provided these: these are stored in Amazon’s S3 cloud storage service.These are what we call “static data”: they don’t change very often. If you have a photo associated with your Google ID, we get that from Google – along with your name and email address – at the time you sign up as a Kerika user, but you can always change your photo by going to your Kerika preferences page.

Then, there’s all the information about which projects and templates you have in your account: this information is also stored in the MySQL database on EC2.

  • There are projects that you create in your own account,
  • There are projects that other people (that you authorize) create in your account,
  • There are projects that you create in other people’s accounts.
  • And, similarly, there are templates that you create in your own account or in other people’s accounts.

Within each project or template you will always have a specified role: as Account Owner, Project Leader, Team Member or Visitor – Kerika tracks all that, so we make sure that you can view and/or modify only those items to which you have been given access.

Projects and templates can be Task Boards, Scrum Boards or Whiteboards:

  • In Task Boards and Scrum Boards, work is organized using cards, which in turn could contain attachments including canvases.
  • In Whiteboards, ideas and content are organized on flexible canvases, which can be nested inside each other.

With Whiteboards, and canvases attached to cards on Task Boards and Scrum Boards, all the data are stored in MySQL.

With cards on Task Boards and Scrum Boards:

  • Files attached to cards are stored in your Google Drive,
  • The title, description, URLs, tags, people and dates are stored in MySQL,
  • Card history is stored in a Dynamo database on AWS.

So, our main database is MySQL, but we also use Dynamo as a NoSQL database to store history, and that’s because history data are different from all other data pertaining to cards and projects:

  • The volume of history is essentially unpredictable, and often very large for long-living or very active projects.
  • History data are a continuous stream of updates; they aren’t really attributes in the sense of relational data.
  • History data is accessed infrequently, and then it is viewed all at once (again, an aspect of being a continuous stream rather than attributes).

It’s also important to note what we don’t store:

  • We never store your password; we never even see it because of the way we interact with Google (using OAuth 2.0)
  • We never store your credit card information; we don’t see that either because we hand you off to Google Wallet for payment.

Along the way to a better search, a deeper dive into Amazon Web Services

We have been busy building a great new Search function: the old search worked only with whiteboards, but the new search indexes absolutely everything inside Kerika: cards, chat, attachments – the whole lot.

We will talk about Search in a separate blog post; this article is about the detour we made into Amazon Web Services (AWS) along the way…

Now, we have always used AWS: the Kerika server runs on an EC2 machine (with Linux, MySQL and Jetty as part of our core infrastructure), and we also use Amazon’s Dynamo Database for storing card history – and our use of various databases, too, deserves its own blog post.

We also use Amazon’s S3 cloud storage, but in a limited way: today, only some static data, like account logos and user photos are stored there.

The new Search feature, like our old one, is built using the marvelous Solr platform, which is, in our view, one of the best enterprise search engines available. And, as is standard for all new features that we build, the first thing we did with our new Search function was use it extensively in-house as part of our final usability testing. We do this for absolutely every single thing we build: we use Kerika to build Kerika, and we function as a high-performing distributed, agile team!

Sometimes we build stuff that we don’t like, and we throw it away… That happens every so often: we hate it when it does, because it means a week or so of wasted effort, but we also really like the fact that we killed off a sub-standard feature instead of foisting crapware on our users. (Yes, that, too, deserves its own blog post…)

But our new Search is different: we absolutely loved it! And that got us worried about what might happen if others liked it as much: search can be a CPU and memory intensive operation, and we became worried that if our Search was so good that people started using it too much, it might kill the performance of the main server.

So, we decided to put our Solr engine on a separate server, still within AWS. To make this secure, however, we needed to create a Virtual Private Cloud (VPC) so that all the communications between our Jetty server and our Solr server takes place on a subnet, using local IP references like 10.0.0.1 which cannot be accessed by people outside the VPC. This makes it impossible for anyone outside the VPC to directly access the Solr server, adding an important layer of security.

To communicate between the Jetty server and the Solr server, we have started using Amazon’s Simple Queue Service (SQS).

OK, that means we add VPC to our suite of AWS services, but this started triggering a wider review of whether we should use more AWS services than we currently do. One sore point of late had been our monitoring of the main server: our homemade monitoring software had failed to detect a brief outage (15 minutes total, which apparently no one except our CEO noticed :0) and it was clear that we needed something more robust.

That got us looking at Amazon’s CloudWatch which can be used with Amazon’s Elastic Load Balancer (EBS) to get more reliable monitoring of CPU thresholds and other critical alerts. (And, along the way, we found and fixed the bug which caused the brief outage: our custom Jetty configuration files were buggy, so we dumped them in favor of a standard configuration which immediately brought CPU utilization down from a stratospheric level to something more normal.)

We didn’t stop there: we also decided to use Amazon’s Route 53 DNS service, which provides greater flexibility for managing subnets than our old DNS.

In summary, we have greatly expanded our Amazon footprint:

  • EC2 for our main Web servers, running Linux, Jetty, MySQL, with separate servers for Solr.
  • S3 for basic storage.
  • Dynamo for history storage.
  • VPC for creating a subnet.
  • SQS for monitoring.
  • CloudWatch for monitoring.
  • Elastic Load Balancer for connecting to servers.
  • Route 53 for DNS.

Something from Amazon that we did abandon: we had been using their version of Linux; we are switching in favor of Ubuntu since that matches our development environment. When we were trying to debug the outage caused by the high CPU utilization, one unknown factor was how Amazon’s Linux works, and we decided it was an unknown that we could live without:

  • First of all, why is there an Amazon Linux in the first place, as in: why did Amazon feel they need to make their own Linux distribution? Presumably, this dates back to the very early days of AWS. But is there any good reason to have a vendor-specific Linux distribution today? Not as far as we can tell…
  • It just adds unnecessary complexity: we are not Linux experts, and have no interest in examining the fine print to determine how exactly Amazon’s Linux might vary from Ubuntu.

Unless you have in-house Linux experts, you, too, would be better off going with a well-regarded, “industry-standard” (yes, we know there’s no such thing in absolute terms but Ubuntu comes pretty close) version of Linux than dealing with any quirks that might exist within Amazon’s variant. When you are trying to chase down mysterious problems like high CPU utilization, the last thing you want is to have to examine the operating system itself!

What we continue to use from Google:

  • Google login and restriction, based upon OAuth 2.0,
  • Google Drive for storing user’s local files.

All the pieces are coming in place now, and we should be able to release our new Search feature in a day or two!
Here be Dragons: the Terra Incognita of Distributed Agile

Traditional Scrum methods don’t help if you are dealing with distributed agile teams: in fact, the traditional answer to how you can manage distributed agile is “Pick distributed or agile; you can’t have both.”

Recently, Arun Kumar (founder and CEO of Kerika) gave a presentation to the Seattle Software Process Improvement Network (SeaSPIN), reviewing three generic strategies for managing distributed agile teams:

  • Divide by location
  • Divide by function
  • Divide by component

The talk was very well received, so here it is as a Slideshare presentation:

iOS 7 Maps: more beautiful than before, still slightly insane.

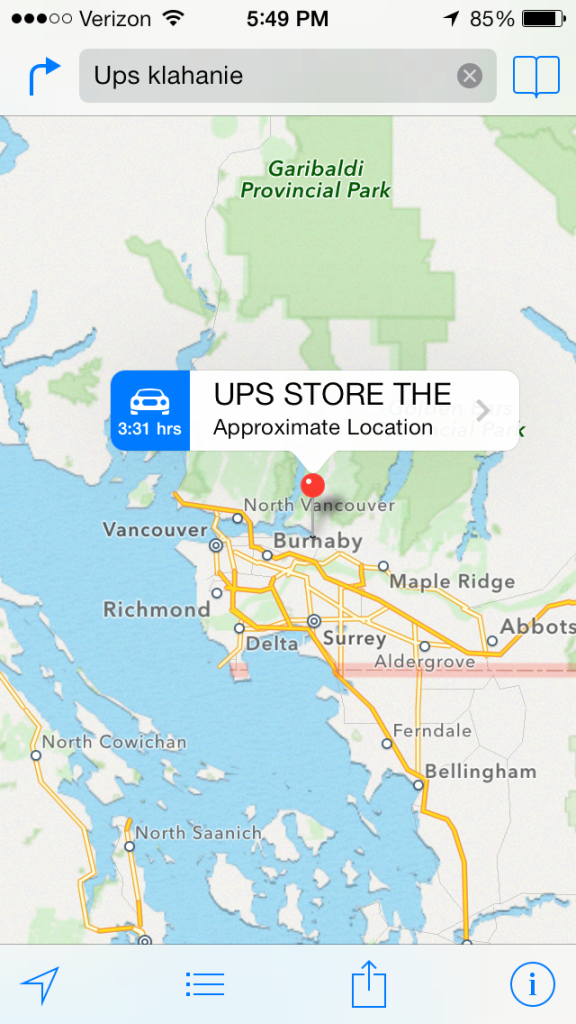
Here’s a simple screenshot that shows why Apples iOS 7 Maps is more beautiful than ever, but still slightly insane… Here’s what happens if you search for “Ups klahanie”, while standing on Klahanie Boulevard in Issaquah, Washington: Apple suggests you go to a UPS store in Vancouver, British Columbia. In other words, it finds a suitable destination for you that’s in another country altogether.

Searching for the nearest UPS store


The basic flaw with iOS Maps, as we have noted before, is that it makes no effective use of GPS data even though the software was created for use only with iPhones, all of which, always, have had GPS capabilities. This has been

But this particular search provides a clue to what’s actually going in Apple’s servers: the word “Klahanie” means “outdoors” in the Chinook language, and the Chinook people can be found across several places in the Pacific Northwest region, beyond their origins in the lower Columbia River region (where Washington State borders Oregon).

So, somewhere in Vancouver the Chinook influence has also resulted in a local street being named Klahanie, and that’s triggered Apple’s Maps to serve up that absurd result (instead of the UPS store that was less than a mile away from where the search was being done).

Comparing Apples to Oranges: No, rolling out Obamacare isn’t like a tech product launch

As Obamacare goes live today, President Obama had this to say about the initial glitches:

Like every new law, every new product rollout, there are going to be some glitches in the sign-up process along the way that we will fix.

Consider that just a couple of weeks ago, Apple rolled out a new mobile operating system, and within days, they found a glitch, so they fixed it. I don’t remember anybody suggesting Apple should stop selling iPhones or iPads or threatening to shut down the company if they didn’t. That’s not how we do things in America.

HHS Secretary Kathleen Seblius added to the metaphor of Obamacare-as-iOS7, which seems to be gaining popularity in the White House:

“Everyone just assumes ‘Well, there’s a problem, they’ll fix it, we’ll move on,’ said Ms. Sebelius. “And like many of their customers I put the ‘new’ new system on my phone and went on my merry way, but it was just a reminder that we’re likely to have some glitches. We will fix them and move on. Is this a sign that the law is flawed and failed? I don’t think so. I think it’s a sign that we’re building a piece of complicated technology, we want it to work, we want it to work right. We’ve got an incredible team working 24/7 to do just that.”

So is rolling out a new healthcare system like rolling out a new tech product? Not in these ways:

  • A tech company wouldn’t announce a new product 3 years in advance, with a fixed, immovable launch date and then bet the company on that launch. (Unless that company is Blackberry.)
  • A too-be-launched-in-3-years product wouldn’t have its specifications laid out in such minute detail, in public, and then frozen with no hope of adapting to changing circumstances.
  • A soft launch would precede the hard launch: just like iOS7 went into beta for several months with a select group of trained developers, Obamacare would have had its own “beta citizens.”
  • A beta product would be backed up by an Agile methodology, so that a fast cycle time would support quick updates and bug fixes. Yes, the State of Washington has embraced “lean government”, but has the rest of the US?

Unless governments become as agile as the best tech companies, we should perhaps not model major policy changes on product launches.


Bug, fixed: a scheduler job that was killing performance on the Kerika server

Our apologies to anyone who was affected by this bug: the email scheduler we built (about a month ago) had a bug that caused CPU utilization to periodically spike all the way up to 100%, and this in turn caused the server to temporarily freeze. We have fixed this bug, thanks in part to a couple of intrepid users, from Poland and the UK, who gave us some important clues.

By way of background: we have a scheduler program that runs periodically on the Kerika server doing various daily tasks. One such task is resending invitations that have not yet been accepted (or rejected, as the case may be); another task is providing a daily summary of each user’s outstanding tasks.

The resending of invitations takes place at a fixed time, but the creation of the daily summary is more complex, since the system sends each user his/her daily summary at 6AM based upon that user’s last known location. This means, for example, that a user based in Seattle would get his daily summary sent at 6AM Pacific Time, and a user based in India would get her summary sent at 6AM Indian Standard Time.

The bug: there was some overly complex SQL queries being used by the scheduler that was causing the server’s CPU consumption to spike all the way up to 100%. In effect, when the scheduler did one of these complex queries, nothing else could move on the server, and the result was an erratic user experience. Not good.

Why it wasn’t found before: because the scheduler ran at different times during the day, based upon the geo-location/distribution of our users, the behavior was not observed in a consistent manner. As our user base grew, the spikes occurred at different times during the day, and we didn’t make the connection.

How it was fixed: the old, complex SQL queries were taking 3-4 seconds to execute; replacing them with a couple of simple queries cut the time down to 1-2 milliseconds. That’s a 2,000X improvement!

Lessons learned: avoid complacency, even for what look like simple, routine programming. Use a profiler. And always respond to user complaints within 24 hours or less, like we always have.

Adding files to cards and canvases: in Internet Explorer 9, and other browsers

Adding files from your desktop to a card or canvas in Kerika is now easier than before: providing you are using Firefox, Chrome or Safari…

Internet Explorer 9, however, remains less elegant. And that won’t change until folks start moving off IE9 to IE10 (or, at a minimum, stop running IE9 in the dreaded “compatibility mode” which Kerika won’t support at all!)

There are several ways you can add files to your cards or canvas, all of which result in the files being uploaded to your Google Drive and shared automatically, seamlessly with your project team members:

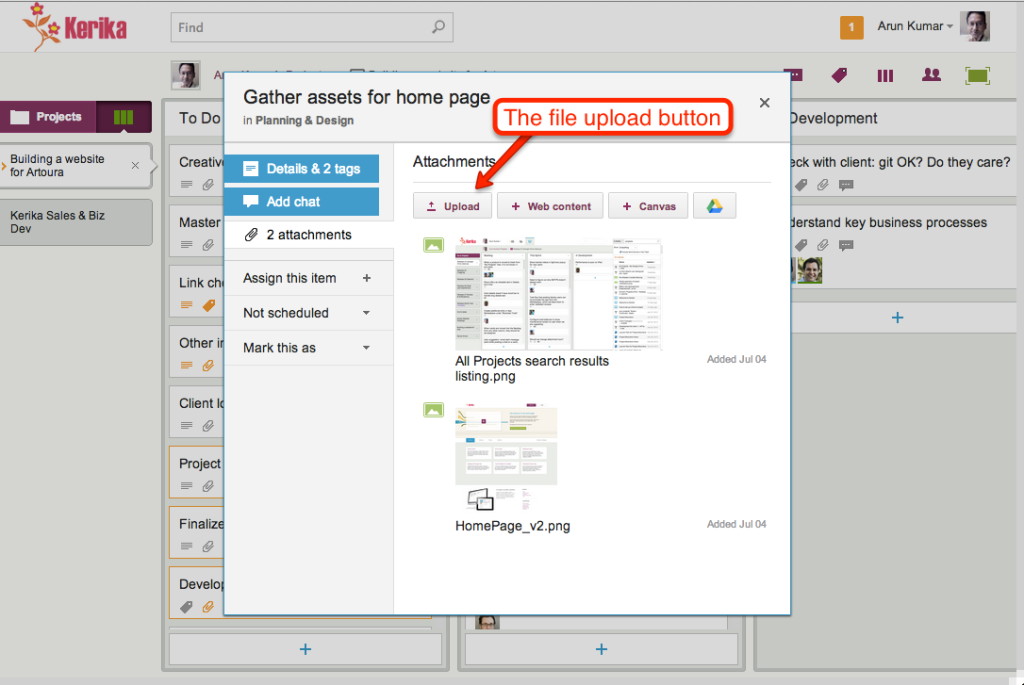
Use the upload button inside the card details display, like this:

Adding files using the File Upload button

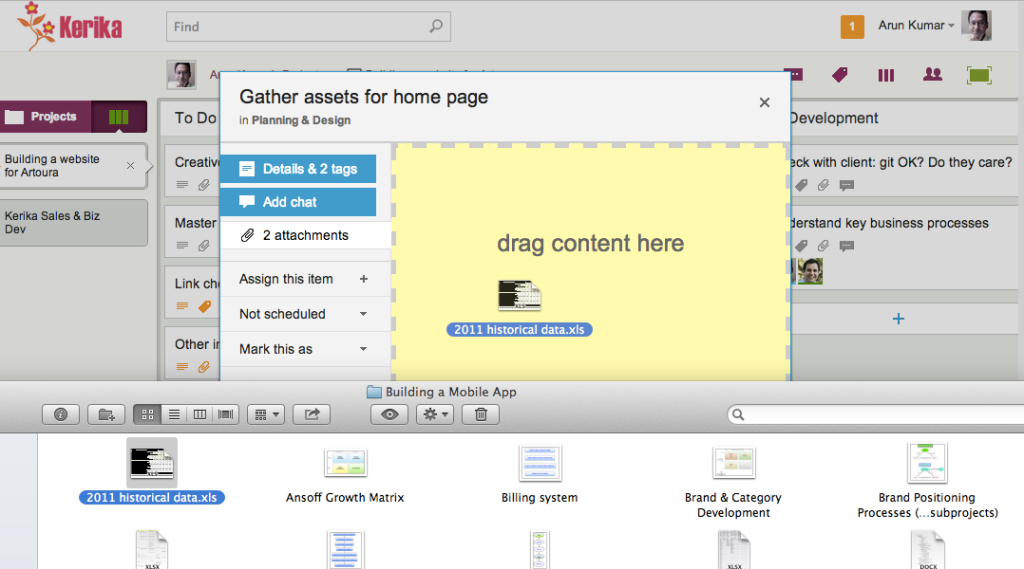
Drag and drop a file onto a card details display, like this:

Dragging and dropping onto card details

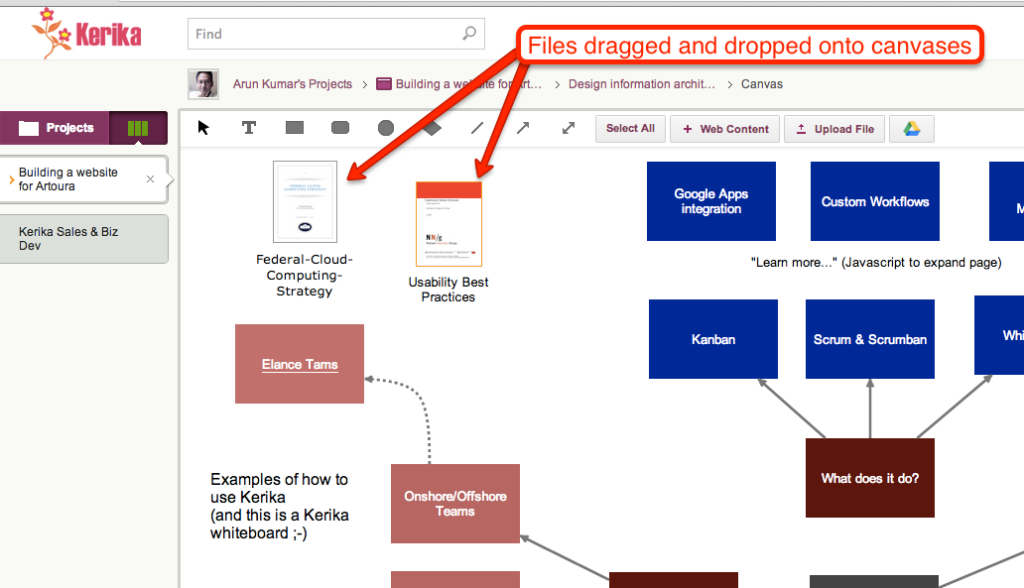
Drag and drop a file onto a canvas, like this:

Files dragged and dropped onto canvases

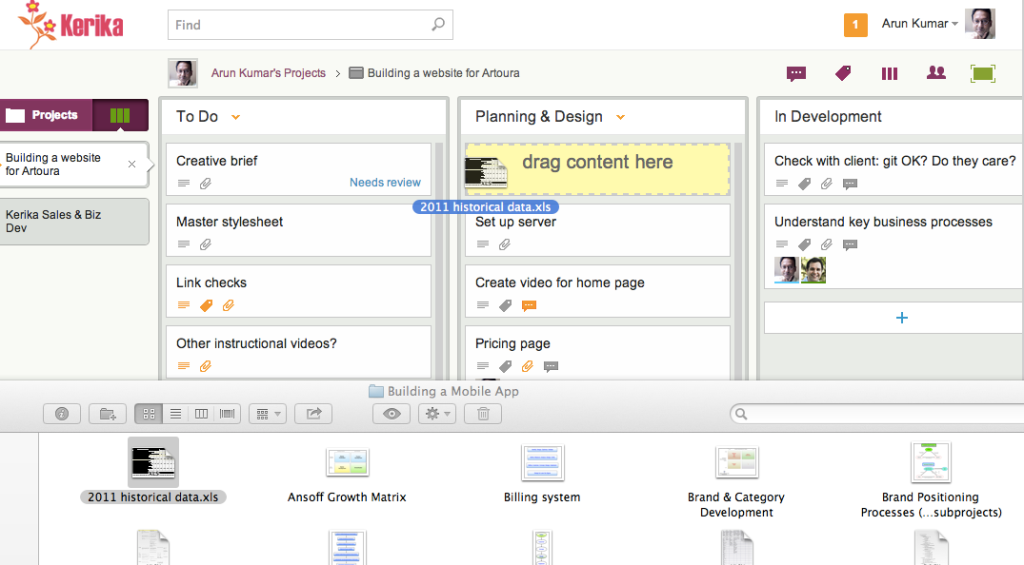
Drag and drop a file onto a card on the task board itself, like this:

Dragging and dropping a file onto a task board

All of these work on Firefox, Chrome and Safari, but with Internet Explorer 9 only the first method works: you have to click on Upload button.

There isn’t much we can do about it, since Internet Explorer’s implementation of the HTML5 standard was so erratic… Sorry.