One great advantage of a visual task board like Kerika is that it is a really fast and easy way to identify bottlenecks in your workflow, far better than relying upon burndown charts.
Here are a couple of real-life examples:
Release 33 and Release 34 are both Scrum iterations, known as “Sprints”.
Both iterations take work items from a shared Backlog – which, by the way, is really easy to set up with Kerika, unlike with some other task boards ;-) And for folks not familiar with Scrum, here’s a handy way to understand how Scrum iterations progressively get through a backlog of work items:
We could rely upon burndown charts to track progress, but the visual nature of Kerika makes it easy to identify where the bottlenecks are:
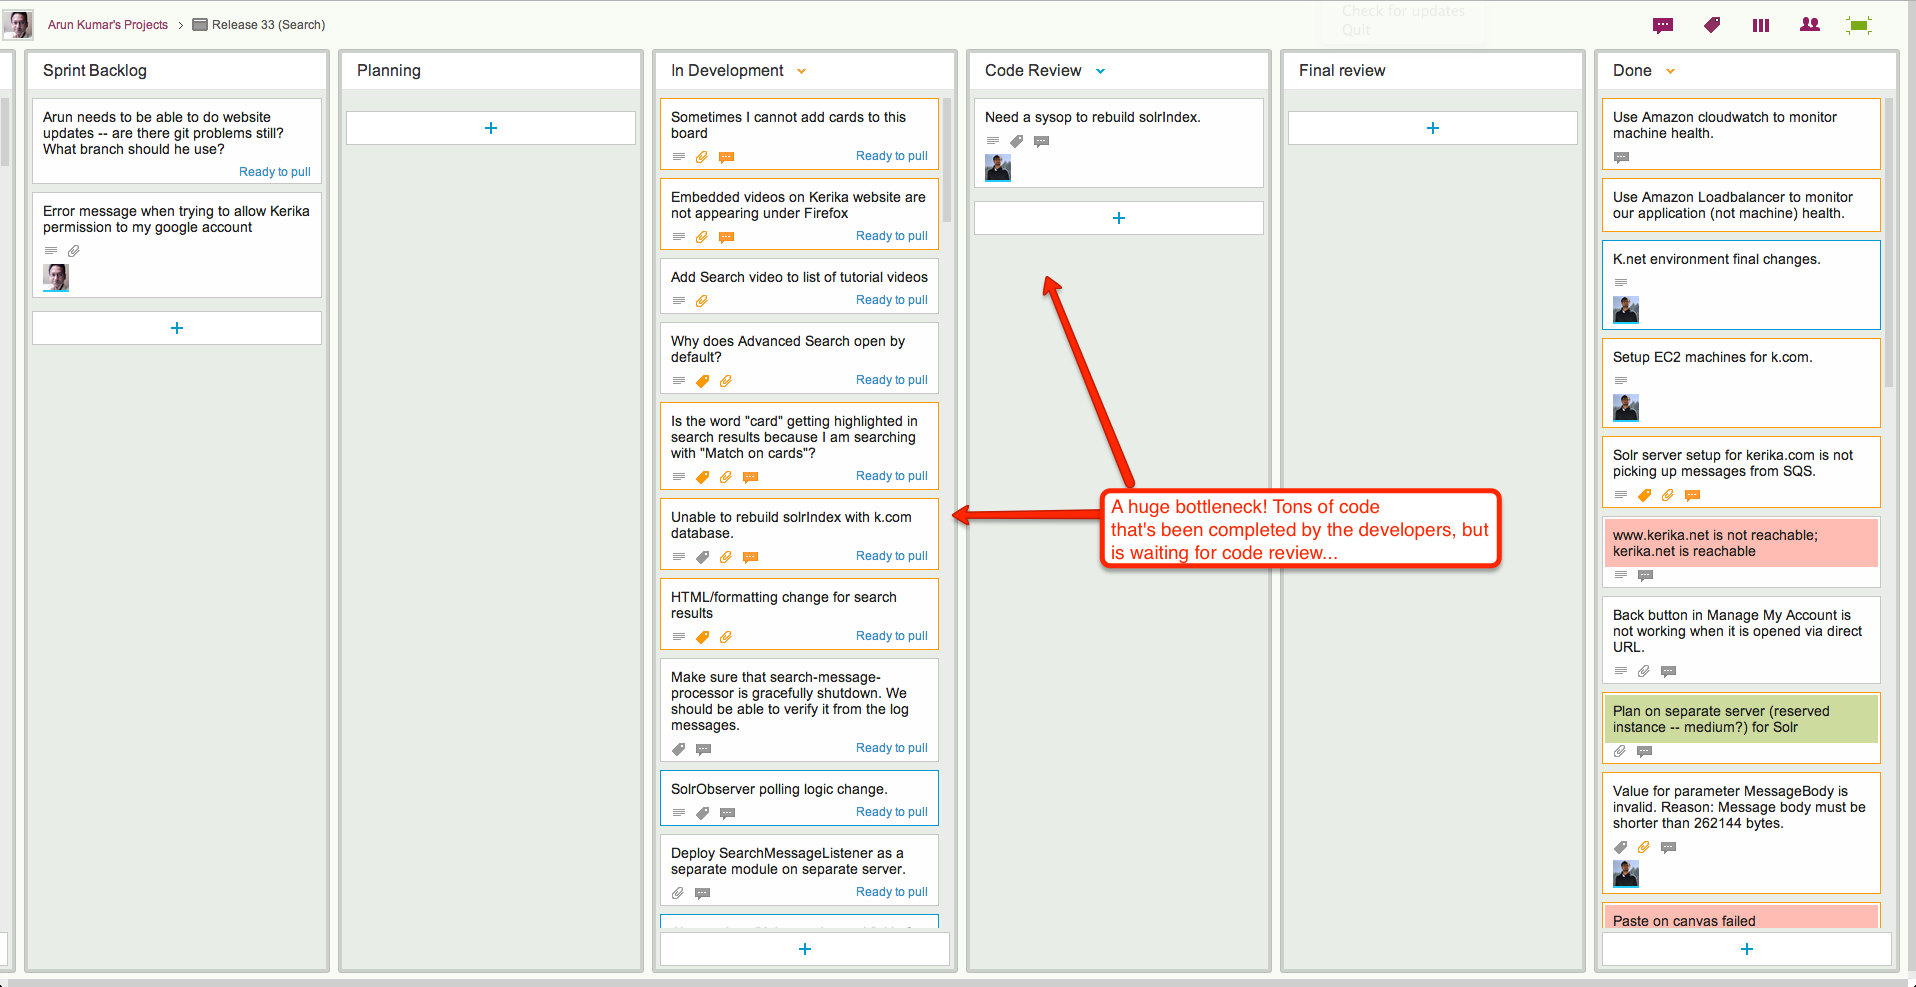
In Release 33, the bottleneck is obviously within the Development phase of the project:
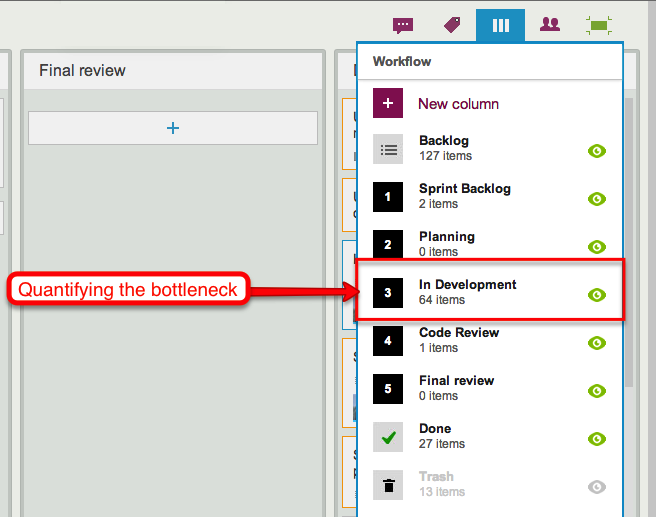
When we take a look at the Workflow display, it’s easy to quantify the problem:
By way of contrast, here’s Release 34, another Scrum iteration that’s working off the same Backlog:
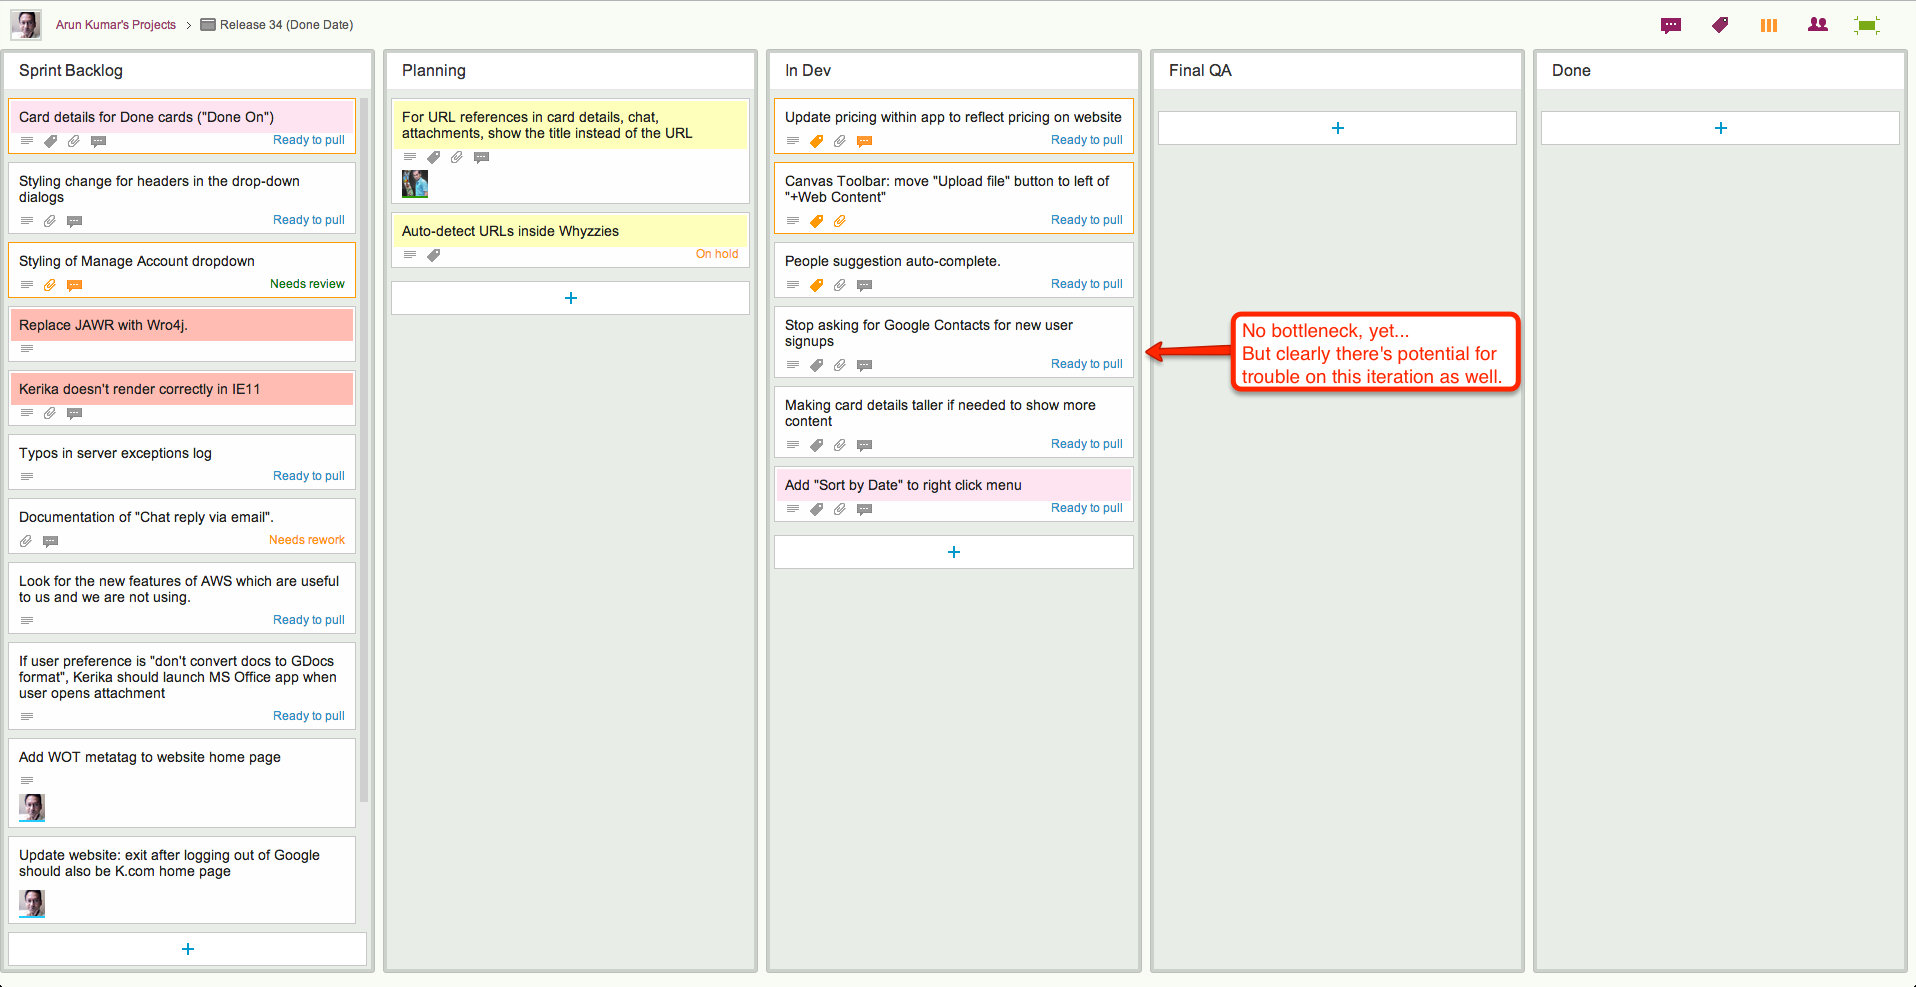
This iteration doesn’t have the same bottleneck as Release 33, but warning signs are clear: if we can’t get our code reviews done fast enough, this version, too, will have a develop a crunch as more development gets completed but ends up waiting for code reviews.
In both cases, Kerika makes it easy to see at a glance where the bottleneck is, and that’s a critical advantage of visual task boards over traditional Scrum tools.