Monthly Archives: December 2013

What a CPU spike looks like

We have been experiencing a CPU spike on one of our servers over the past week, thanks to a batch job that clearly needs some optimization.

The CPU spike happens at midnight, UTC (basically, Greenwich Mean Time), when the job was running, and it looks like this:

CPU spike
CPU spike

It’s pretty dramatic: our normal CPU utilization is very steady, at less than 30%, and the over a 10-minute period at midnight it shoots up to nearly 90%.

Well, that sucks. We have disabled the batch job and are going to take a closer look at the SQL involved to optimize the code.

Our apologies to users in Australia and New Zealand: this was hitting the middle of their morning use of Kerika and some folks experienced slowdowns as a result.

How we manage our Bugs Backlog

Talk to old-timers at Microsoft, and they will wax nostalgic about Windows Server 2003, which many of the old hands describe as the best Windows OS ever built. It was launched with over 25,000 known bugs.

Which just goes to show: not all bugs need to be fixed right away.

Here at Kerika we have come up with a simple prioritization scheme for bugs; here’s what our board for handling server-related bugs looks like:

How we prioritize errors
How we prioritize errors (click to enlarge)

This particular board only deals with exceptions logged on our servers; these are Java exceptions, so the cards may seem obscure in their titles, but the process by which we handle bugs may nonetheless be of interest to others:

Every new exception goes into a To be Prioritized column as a new card. Typically, the card’s title includes the key element of the bug – in this case, the bit of code that threw the exception – and the card’s details contain the full stack trace.

Sometimes, a single exception may manifest itself with multiple code paths, each with its own stack trace, in which case we gather all these stack traces into a single Google Docs file which is then attached to the card.

With server exceptions, a full stack trace is usually sufficient for debugging purposes, but for UI bugs the card details would contain the steps needed to reproduce the bug (i.e. the “Repro Steps”).

New server exceptions are found essentially randomly, with several exceptions being noted in some days and none in other days.

For this reason, logging the bugs is a separate process from prioritizing them: you wouldn’t want to disturb your developers on a daily basis, by asking them to look at any new exceptions they are found, unless the exceptions point to some obviously serious errors. Most of the time the exceptions are benign, and perhaps annoying, rather than life-threatening, so we ask the developers to examine and prioritize bugs from the To be Prioritized column only as they periodically come up for air after having tackled some bugs.

Each bug is examined and classified as either High Priority or Ignore for Now.

Note that we don’t bother with a Medium Priority, or, worse yet, multiple levels of priorities (e.g. Priority 1, Priority 2, Priority 3…). There really isn’t any point to having more than two buckets in which to place all bugs: it’s either worth fixing soon, or not worth fixing at all.

The rationale for our thinking is simple: if a bug doesn’t result in any significant harm, it can usually be ignored quite safely. We do about 30 cards of new development per week (!), which means we add new features and refactor our existing code at a very rapid rate. In an environment characterized by rapid development, there isn’t any point in chasing after medium- or low-priority bugs because the code could change in ways that make these bugs irrelevant very quickly.

Beyond this simple classification, we also use color coding, sparingly, to highlight related bugs. Color coding is a feature of Kerika, of course, but it is one of those features that needs to be used as little as possible, in order to gain the greatest benefit. A board where every card is color-coded will be a technicolor mess.

In our scheme of color coding, bugs are considered “related” if they are in the same general area of code, which provides an incentive for the developer to fix both bugs at the same time since the biggest cost of fixing a bug is the context switch needed for a developer to dive into some new part of a very large code base. (And we are talking about hundreds of thousands of lines of code that make up Kerika…)

So, that’s the simple methodology we have adopted for tracking, triaging, and fixing bugs.

What’s your approach?

A great new Search feature

We updated Kerika today with a great new Search feature that lets you find anything you want, across every card, canvas and project board, across your entire Kerika world!

There’s a short (1:13) video to our YouTube channel that provides a good overview:

Search works across your entire Kerika world: every project board and template to which you have access. This includes projects where you are part of the team, of course, but it also includes public projects created by other folks, like the Foundation for Common Good in the UK, and the transnational WIKISPEED project.

Basic Search will work for most people, most of the time, but we have also built a very powerful Advanced Search feature that lets you zoom in any card on any board or template, using a variety of criteria.

Here’s an example of Basic Search:

Example of basic search

The most likely (top-ranked) item is shown at the top of the list, and is automatically selected so that you can quickly go to it if you are feeling lucky ;-)

For each item that matched your search, Kerika provides a ton of useful metadata:

  • It tells you the name of the card, project or template that matched. (In the example above, it is Identify key players.)
  • If the match was on a card, it tells you the name of the project (or template) board on which the card is located, and the name of the column where the card is located. (In the example above, it is Kerika pilot at Babson College.)
  • It shows a small snippet of the search match, so you can decide whether it is what you were looking for.
  • It even tells you what attribute (aspect) of the card matched your search. (In the example above, the card matched on some text within a canvas that was attached to the card.)

If you want to really zoom in on a particular piece of information, use the Advanced Search feature:

Accessing Advanced Search

The first step towards zooming in is to narrow your search, by focusing on project names, template names, or individual cards:

Accessing Advanced Search
Focusing your Advanced Search

If you are searching for specific cards, you can further narrow your search to focus on titles, descriptions, chat, attachments, people, status, color, and tags:

Options for searching for cards

Searching by different aspects (or facets) can give very different results, as this composite of three searches shows (click on image to enlarge):

Searching by facets
Searching by facets (Click to enlarge)

Other options include searching by people; here, for example, we are trying to find all the cards that are assigned to a specific person:

Searching for People

Any combination of facets is possible: for example, you could search for all cards assigned to someone that are waiting for review.

So, that’s Search in Kerika, the only task board designed specially for distributed teams!


Identifying bottlenecks is easier with visual task boards

One great advantage of a visual task board like Kerika is that it is a really fast and easy way to identify bottlenecks in your workflow, far better than relying upon burndown charts.

Here are a couple of real-life examples:

Release 33 and Release 34 are both Scrum iterations, known as “Sprints”.

How Scrum works
How Scrum works

Both iterations take work items from a shared Backlog – which, by the way, is really easy to set up with Kerika, unlike with some other task boards ;-) And for folks not familiar with Scrum, here’s a handy way to understand how Scrum iterations progressively get through a backlog of work items:

We could rely upon burndown charts to track progress, but the visual nature of Kerika makes it easy to identify where the bottlenecks are:

In Release 33, the bottleneck is obviously within the Development phase of the project:

Release 33: a bottleneck in Development

When we take a look at the Workflow display, it’s easy to quantify the problem:

Quantifying the bottleneck in Release 33

By way of contrast, here’s Release 34, another Scrum iteration that’s working off the same Backlog:

Release 34: a smaller bottleneck

This iteration doesn’t have the same bottleneck as Release 33, but warning signs are clear: if we can’t get our code reviews done fast enough, this version, too, will have a develop a crunch as more development gets completed but ends up waiting for code reviews.

In both cases, Kerika makes it easy to see at a glance where the bottleneck is, and that’s a critical advantage of visual task boards over traditional Scrum tools.

Our use of data stores and databases

A question we are asked fairly often: where exactly is my Kerika data stored?

The answer: some of it is in Amazon Web Services, some of it is in your Google Drive.

Here are the details: your Kerika world consists of a bunch of data, some of which relate to your account or identity, and some relate to specific projects and templates.

Your account information includes:

  • Your name and email address: these are stored in a MySQL database on an Amazon EC2 virtual server.Note: this isn’t a private server (that’s something we are working on for the future!); instead, access is tightly controlled by a system of permissions or Access Control Lists.
  • Your photo and personalized account logo, if you provided these: these are stored in Amazon’s S3 cloud storage service.These are what we call “static data”: they don’t change very often. If you have a photo associated with your Google ID, we get that from Google – along with your name and email address – at the time you sign up as a Kerika user, but you can always change your photo by going to your Kerika preferences page.

Then, there’s all the information about which projects and templates you have in your account: this information is also stored in the MySQL database on EC2.

  • There are projects that you create in your own account,
  • There are projects that other people (that you authorize) create in your account,
  • There are projects that you create in other people’s accounts.
  • And, similarly, there are templates that you create in your own account or in other people’s accounts.

Within each project or template you will always have a specified role: as Account Owner, Project Leader, Team Member or Visitor – Kerika tracks all that, so we make sure that you can view and/or modify only those items to which you have been given access.

Projects and templates can be Task Boards, Scrum Boards or Whiteboards:

  • In Task Boards and Scrum Boards, work is organized using cards, which in turn could contain attachments including canvases.
  • In Whiteboards, ideas and content are organized on flexible canvases, which can be nested inside each other.

With Whiteboards, and canvases attached to cards on Task Boards and Scrum Boards, all the data are stored in MySQL.

With cards on Task Boards and Scrum Boards:

  • Files attached to cards are stored in your Google Drive,
  • The title, description, URLs, tags, people and dates are stored in MySQL,
  • Card history is stored in a Dynamo database on AWS.

So, our main database is MySQL, but we also use Dynamo as a NoSQL database to store history, and that’s because history data are different from all other data pertaining to cards and projects:

  • The volume of history is essentially unpredictable, and often very large for long-living or very active projects.
  • History data are a continuous stream of updates; they aren’t really attributes in the sense of relational data.
  • History data is accessed infrequently, and then it is viewed all at once (again, an aspect of being a continuous stream rather than attributes).

It’s also important to note what we don’t store:

  • We never store your password; we never even see it because of the way we interact with Google (using OAuth 2.0)
  • We never store your credit card information; we don’t see that either because we hand you off to Google Wallet for payment.

Along the way to a better search, a deeper dive into Amazon Web Services

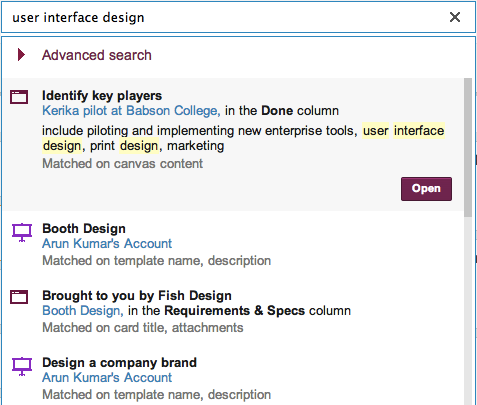
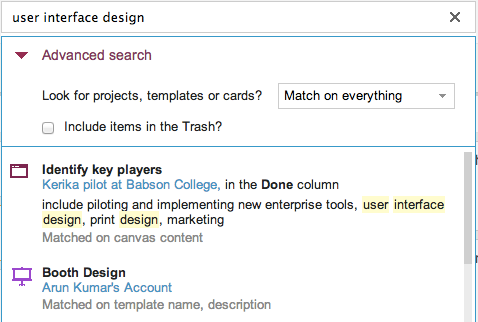
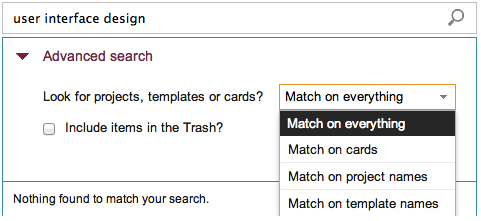
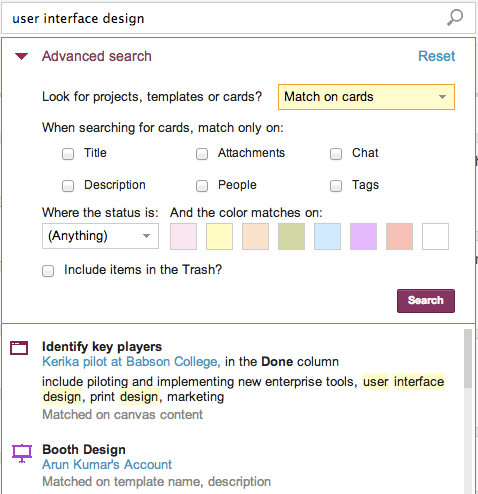
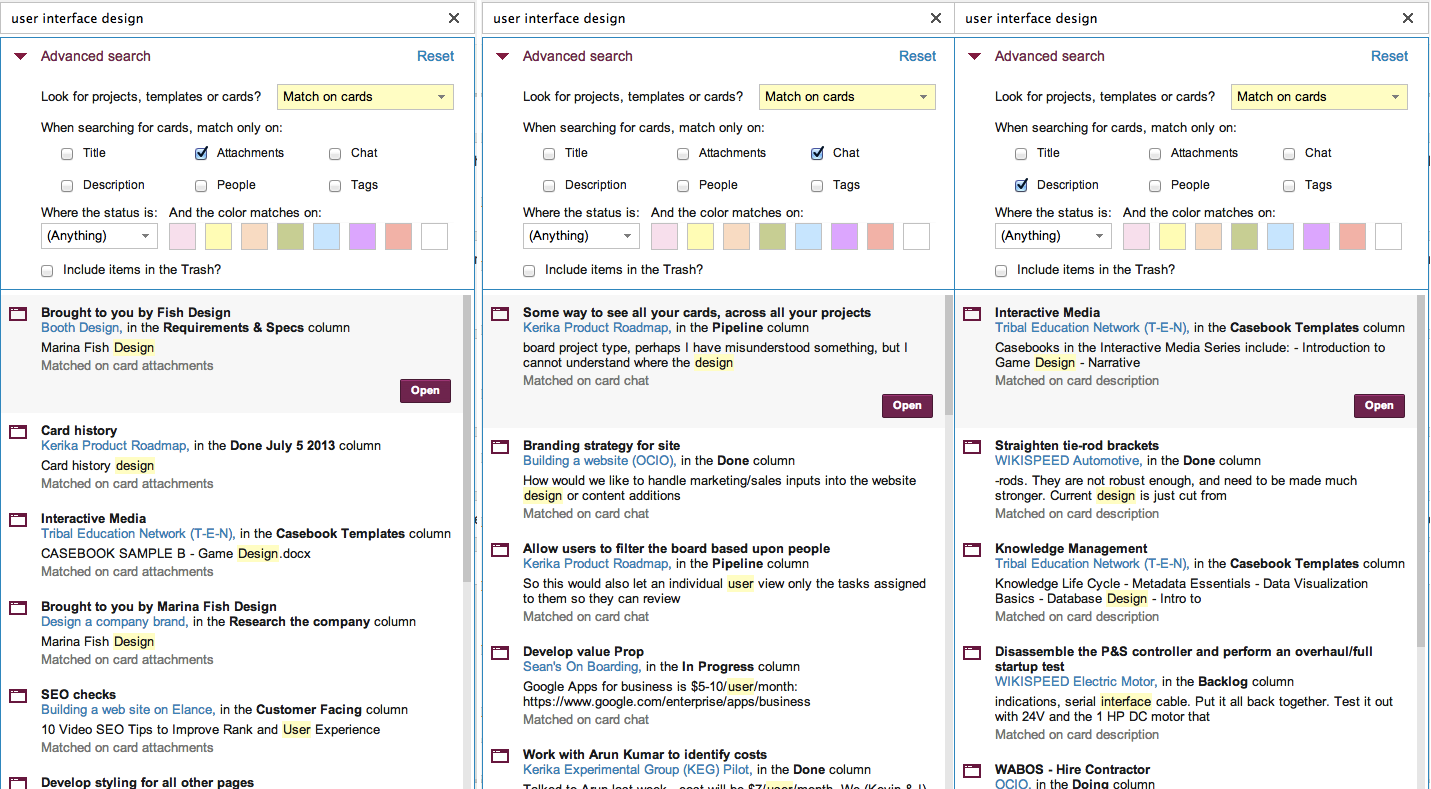
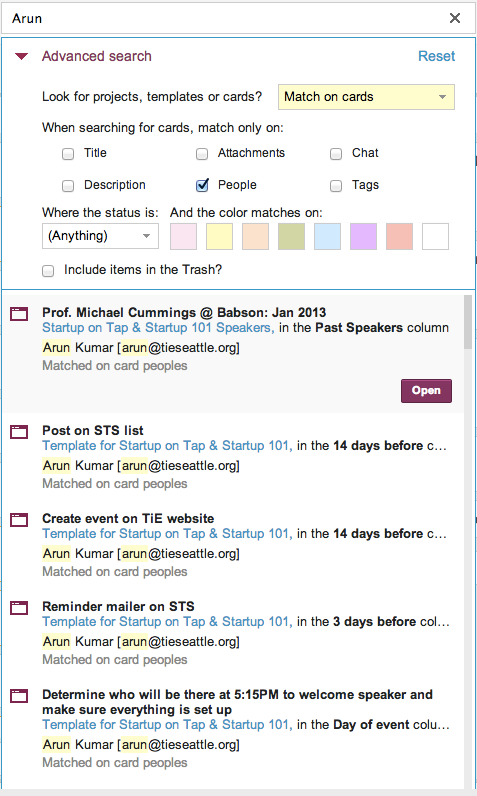
We have been busy building a great new Search function: the old search worked only with whiteboards, but the new search indexes absolutely everything inside Kerika: cards, chat, attachments – the whole lot.

We will talk about Search in a separate blog post; this article is about the detour we made into Amazon Web Services (AWS) along the way…

Now, we have always used AWS: the Kerika server runs on an EC2 machine (with Linux, MySQL and Jetty as part of our core infrastructure), and we also use Amazon’s Dynamo Database for storing card history – and our use of various databases, too, deserves its own blog post.

We also use Amazon’s S3 cloud storage, but in a limited way: today, only some static data, like account logos and user photos are stored there.

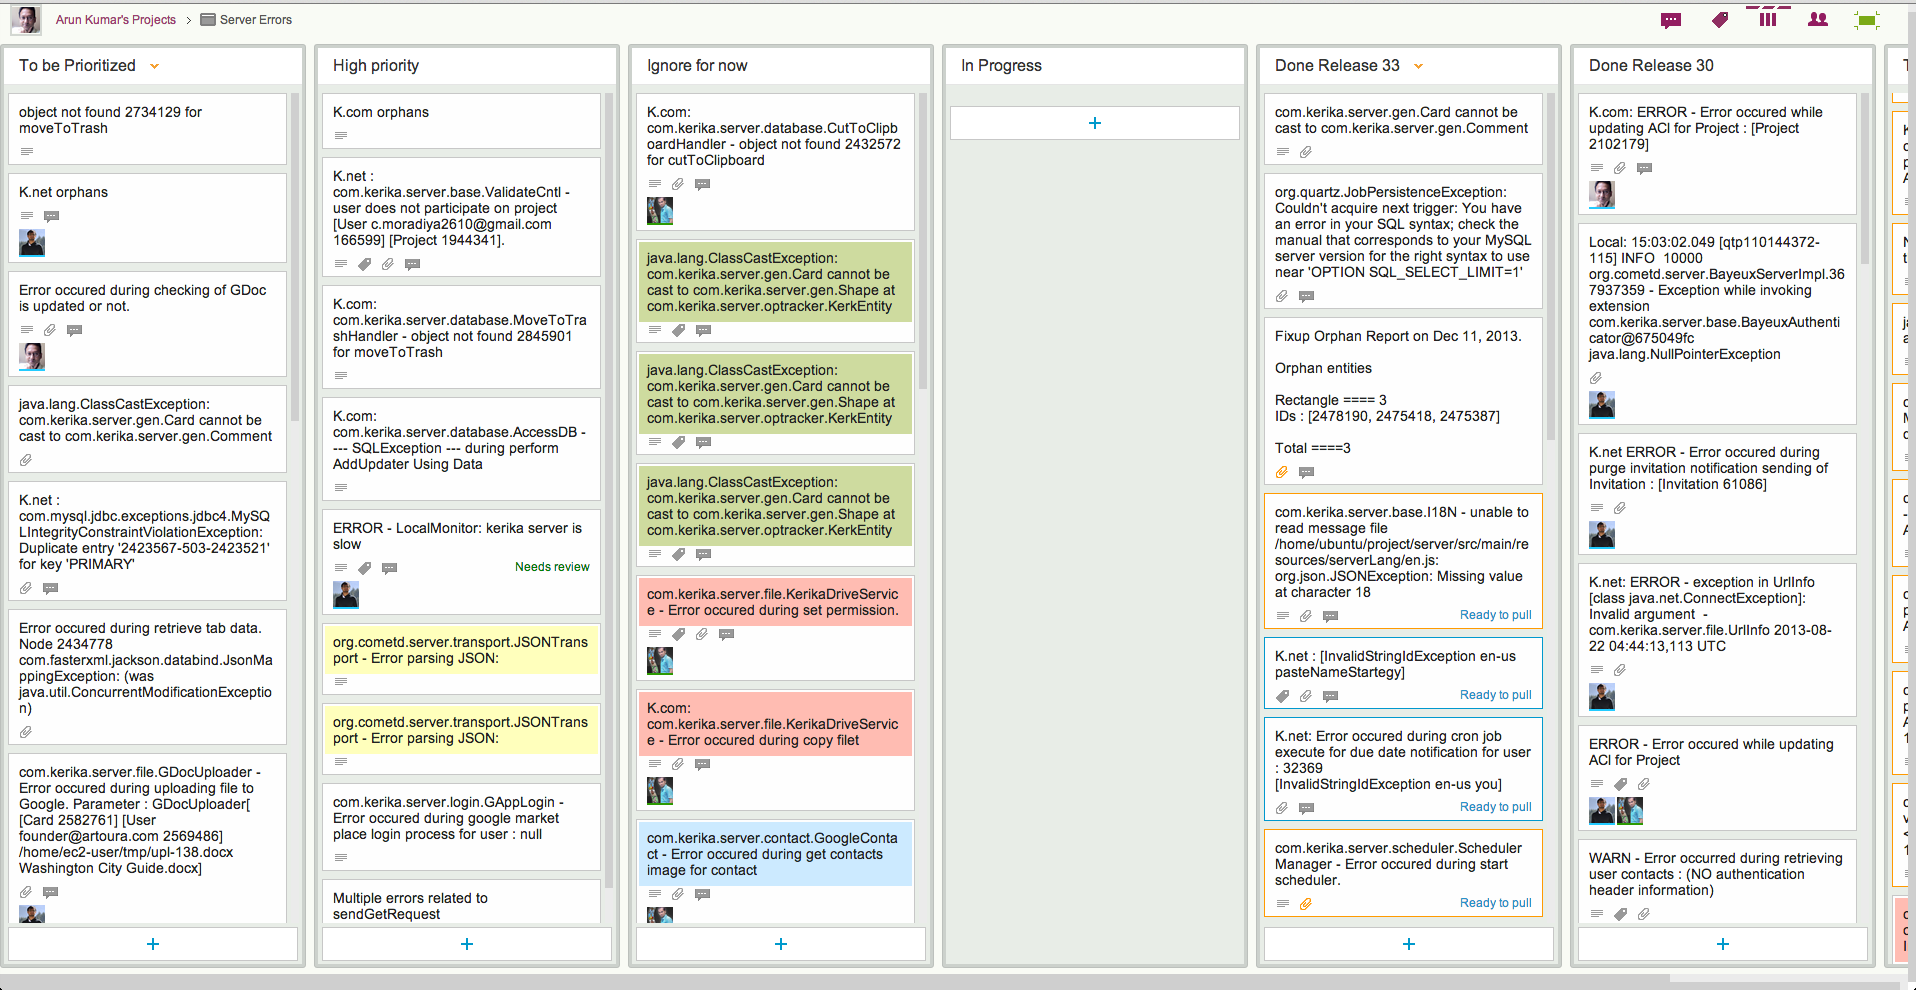
The new Search feature, like our old one, is built using the marvelous Solr platform, which is, in our view, one of the best enterprise search engines available. And, as is standard for all new features that we build, the first thing we did with our new Search function was use it extensively in-house as part of our final usability testing. We do this for absolutely every single thing we build: we use Kerika to build Kerika, and we function as a high-performing distributed, agile team!

Sometimes we build stuff that we don’t like, and we throw it away… That happens every so often: we hate it when it does, because it means a week or so of wasted effort, but we also really like the fact that we killed off a sub-standard feature instead of foisting crapware on our users. (Yes, that, too, deserves its own blog post…)

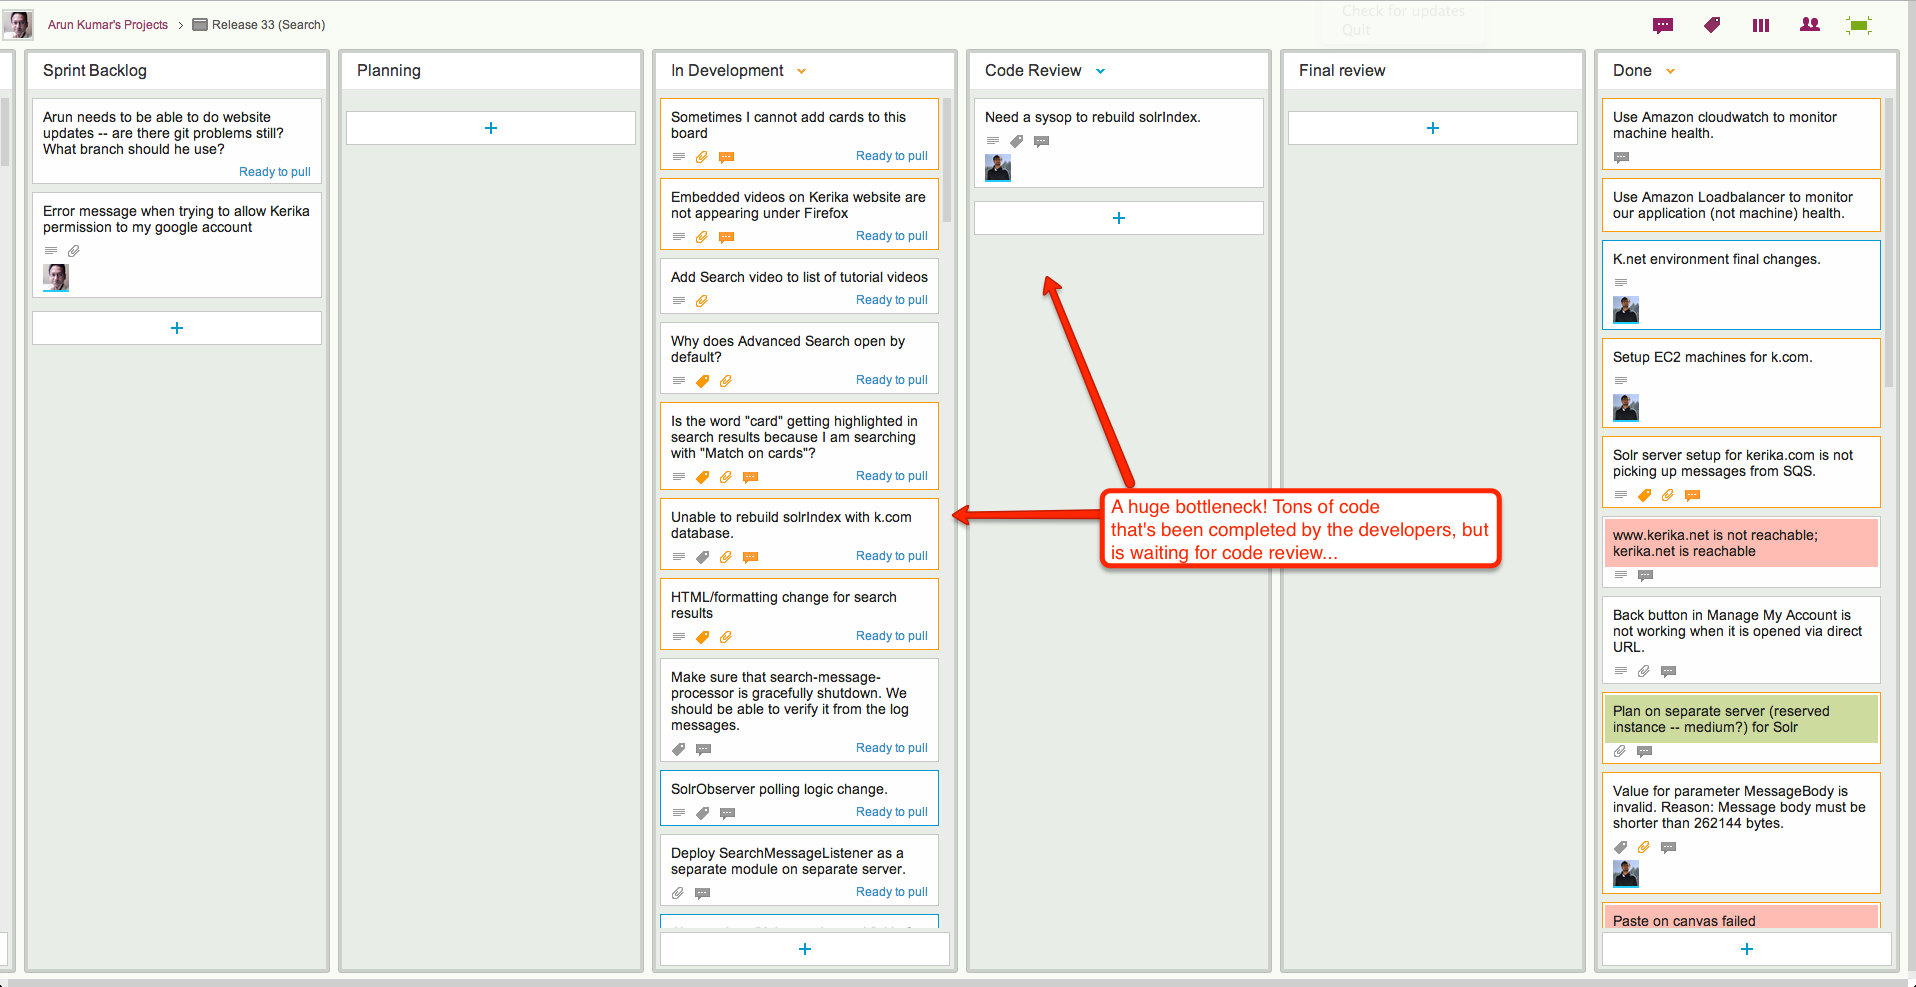
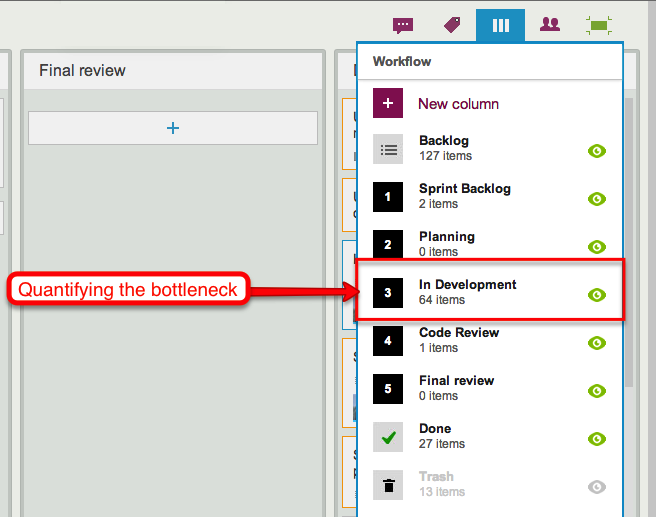
But our new Search is different: we absolutely loved it! And that got us worried about what might happen if others liked it as much: search can be a CPU and memory intensive operation, and we became worried that if our Search was so good that people started using it too much, it might kill the performance of the main server.

So, we decided to put our Solr engine on a separate server, still within AWS. To make this secure, however, we needed to create a Virtual Private Cloud (VPC) so that all the communications between our Jetty server and our Solr server takes place on a subnet, using local IP references like 10.0.0.1 which cannot be accessed by people outside the VPC. This makes it impossible for anyone outside the VPC to directly access the Solr server, adding an important layer of security.

To communicate between the Jetty server and the Solr server, we have started using Amazon’s Simple Queue Service (SQS).

OK, that means we add VPC to our suite of AWS services, but this started triggering a wider review of whether we should use more AWS services than we currently do. One sore point of late had been our monitoring of the main server: our homemade monitoring software had failed to detect a brief outage (15 minutes total, which apparently no one except our CEO noticed :0) and it was clear that we needed something more robust.

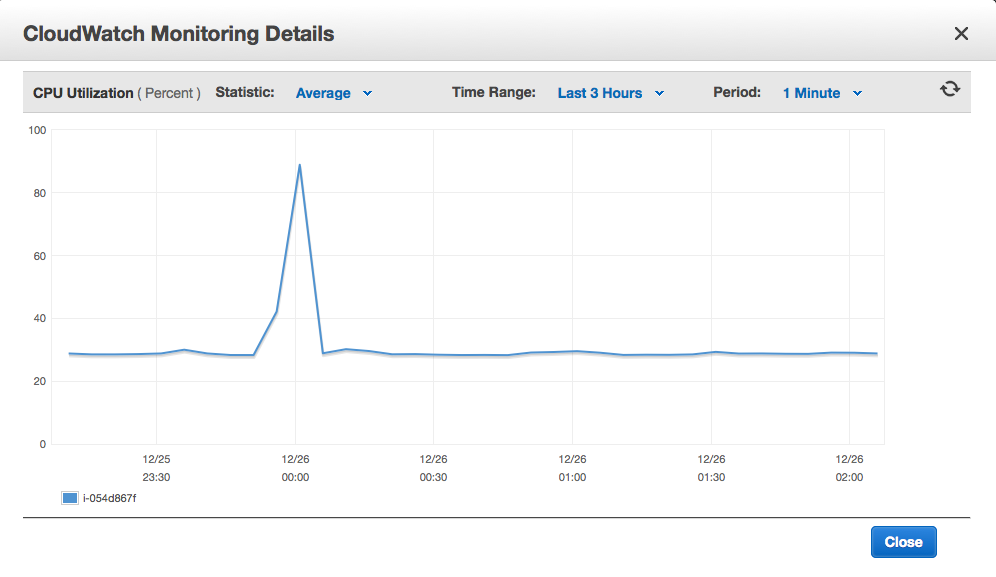
That got us looking at Amazon’s CloudWatch which can be used with Amazon’s Elastic Load Balancer (EBS) to get more reliable monitoring of CPU thresholds and other critical alerts. (And, along the way, we found and fixed the bug which caused the brief outage: our custom Jetty configuration files were buggy, so we dumped them in favor of a standard configuration which immediately brought CPU utilization down from a stratospheric level to something more normal.)

We didn’t stop there: we also decided to use Amazon’s Route 53 DNS service, which provides greater flexibility for managing subnets than our old DNS.

In summary, we have greatly expanded our Amazon footprint:

  • EC2 for our main Web servers, running Linux, Jetty, MySQL, with separate servers for Solr.
  • S3 for basic storage.
  • Dynamo for history storage.
  • VPC for creating a subnet.
  • SQS for monitoring.
  • CloudWatch for monitoring.
  • Elastic Load Balancer for connecting to servers.
  • Route 53 for DNS.

Something from Amazon that we did abandon: we had been using their version of Linux; we are switching in favor of Ubuntu since that matches our development environment. When we were trying to debug the outage caused by the high CPU utilization, one unknown factor was how Amazon’s Linux works, and we decided it was an unknown that we could live without:

  • First of all, why is there an Amazon Linux in the first place, as in: why did Amazon feel they need to make their own Linux distribution? Presumably, this dates back to the very early days of AWS. But is there any good reason to have a vendor-specific Linux distribution today? Not as far as we can tell…
  • It just adds unnecessary complexity: we are not Linux experts, and have no interest in examining the fine print to determine how exactly Amazon’s Linux might vary from Ubuntu.

Unless you have in-house Linux experts, you, too, would be better off going with a well-regarded, “industry-standard” (yes, we know there’s no such thing in absolute terms but Ubuntu comes pretty close) version of Linux than dealing with any quirks that might exist within Amazon’s variant. When you are trying to chase down mysterious problems like high CPU utilization, the last thing you want is to have to examine the operating system itself!

What we continue to use from Google:

  • Google login and restriction, based upon OAuth 2.0,
  • Google Drive for storing user’s local files.

All the pieces are coming in place now, and we should be able to release our new Search feature in a day or two!

Here be Dragons: the Terra Incognita of Distributed Agile

Traditional Scrum methods don’t help if you are dealing with distributed agile teams: in fact, the traditional answer to how you can manage distributed agile is “Pick distributed or agile; you can’t have both.”

Recently, Arun Kumar (founder and CEO of Kerika) gave a presentation to the Seattle Software Process Improvement Network (SeaSPIN), reviewing three generic strategies for managing distributed agile teams:

  • Divide by location
  • Divide by function
  • Divide by component

The talk was very well received, so here it is as a Slideshare presentation: