Creating a picture board as an example of a Whiteboard project

Here’s a really great example of how you can easily create rich Web pages using Kerika:

Example of a Whiteboard project

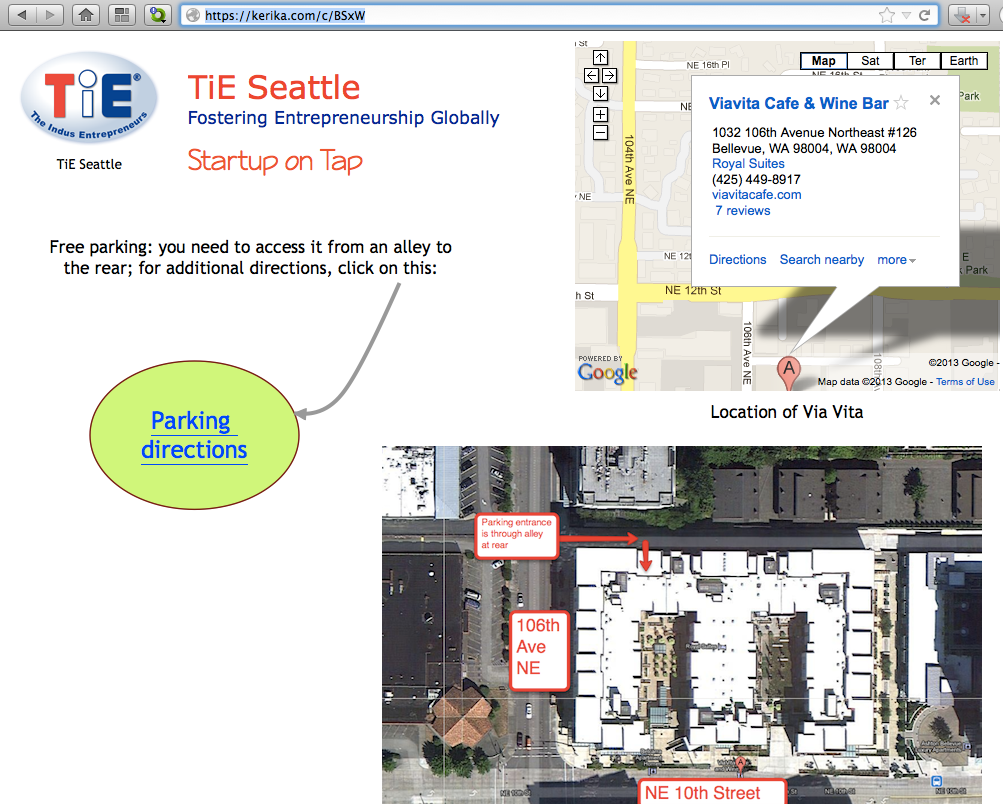
This page was created in just minutes, and can be changed in real-time. The page is an example of Kerika’s Whiteboard projects, being used by the Seattle chapter of The Indus Entrepreneurs (TiE).

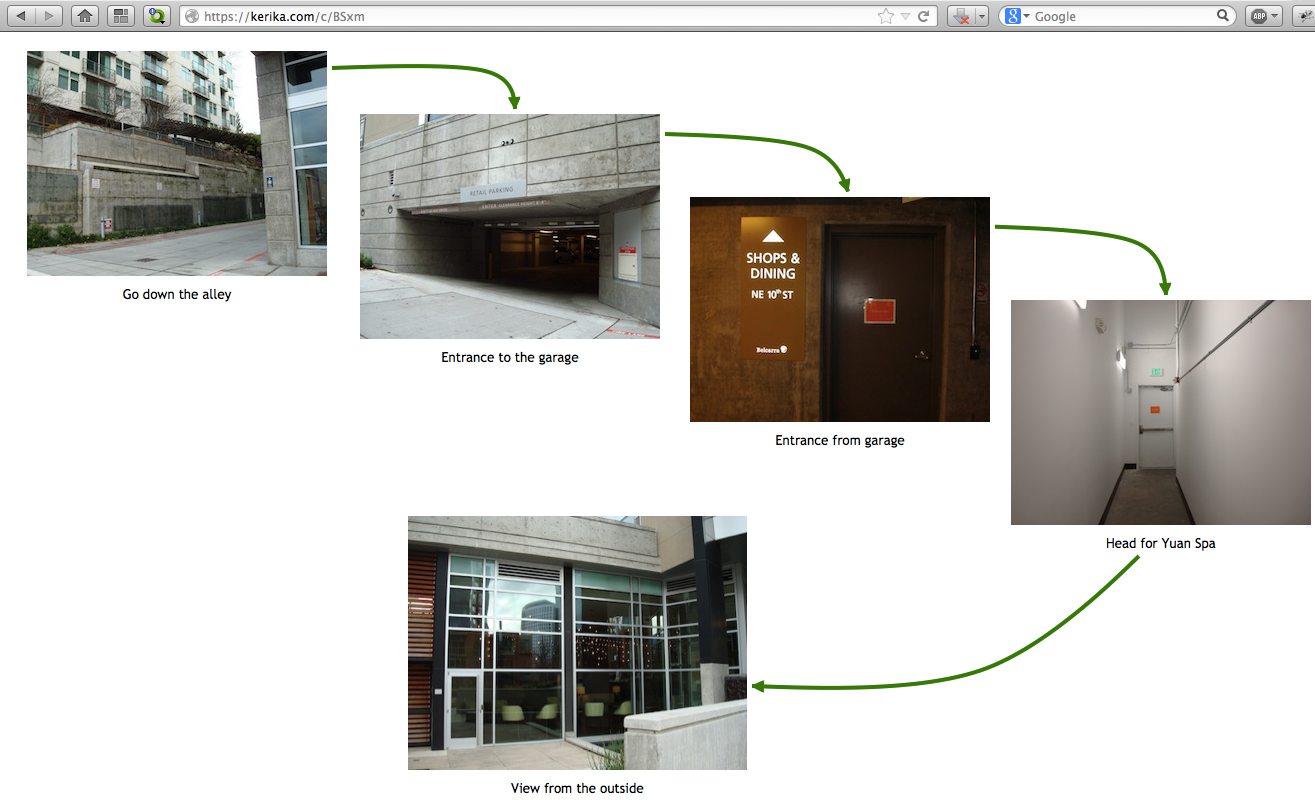
This page is also a great example of you can create pages within pages: just click on the “Parking Directions” shape, and you get taken to another page that’s organized as a picture board:

Example of a picture board

Publishing these web pages is easy and instantaneous: just take the URL of your Kerika project page, and replace the “/m/” in the middle with “/c/” and you will have a real-time Web page that anyone can access, from anywhere, even if they don’t use the Kerika software.

(In this example, the project page is at kerika.com/m/BSxW, and the published page is at kerika.com/c/BSxW)

Want to learn more about how to create these great canvases? Check out this video.

A new pricing scheme, and better controls for your account

Our latest version includes a bunch of usability improvements, as usual, but the biggest changes are to the billing mechanism and account management:

  • Billing: we have updated and simplified our pricing: users told us that the old multi-level pricing was a little complicated, so we have a simpler offer of $10 per user per month for Professional users.
    • You can still start off with a free Standard Account which lets you share your projects with two other people, and if your team is small enough — or you are using Kerika for personal task management only where you don’t have a need to share your projects with others — you will be able to stay with the free Account.
    • Once your account team becomes larger, you can upgrade to a paid Professional Account which will let you add as many users as you like, at a flat rate of $10 per user per month.
    • If you are working on an academic or nonprofit project, you can request free service which lets you have a team of up to 10 people.
    • Billing is done on an annual basis (our users told us that was preferable to monthly renewals, since it was easier for businesses to make annual decisions than to repeatedly make monthly approvals), and you can cancel or reduce your subscription at any time and get a prorated refund.
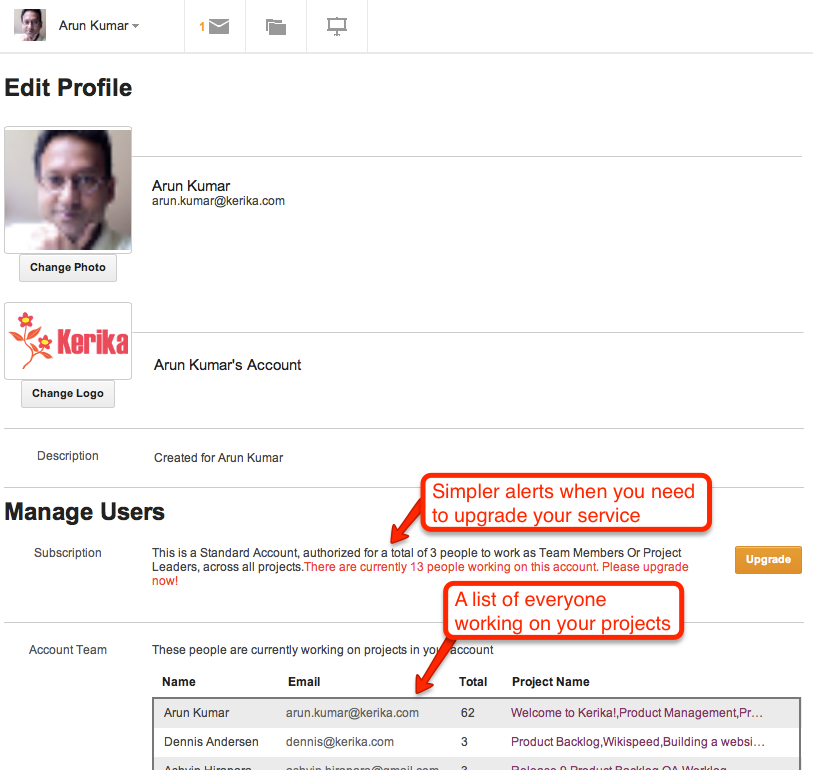
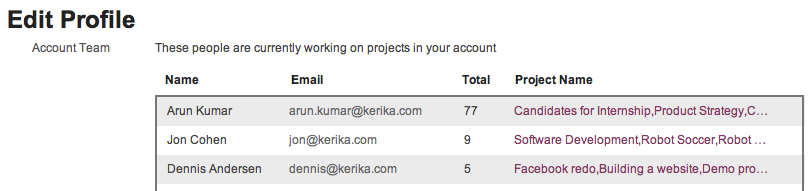
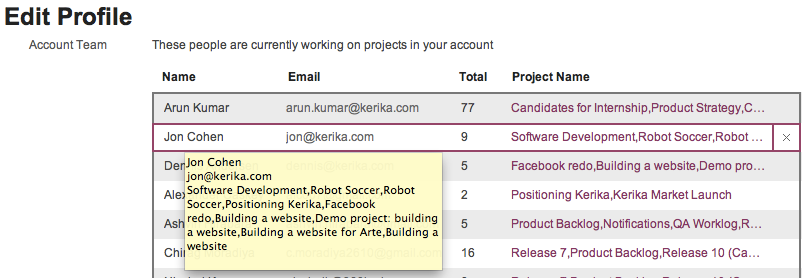
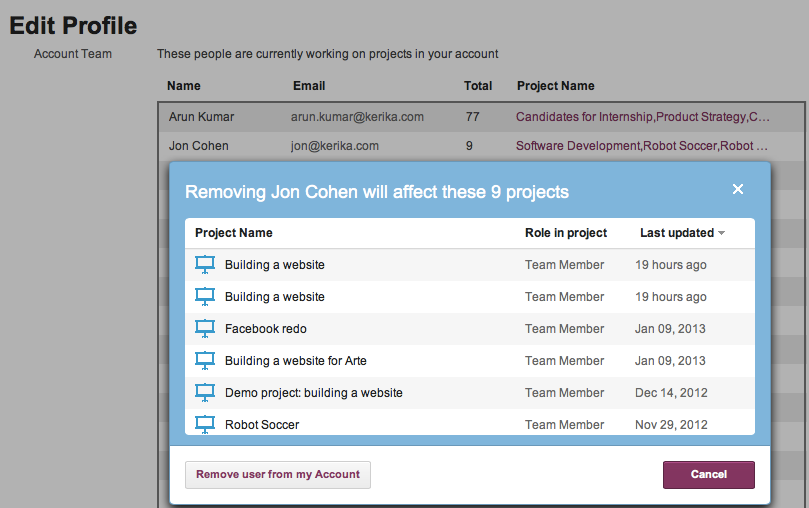
  • Account Management: it’s easier now to see all the users who are part of your account, and to remove someone from all your projects.
Easier to manage your account


  • We made it easier to use templates when setting up new projects: now, you can easily browse your personal library of process templates, templates created by coworkers, and templates provided by Kerika and easily set up a new project.
  • Even better support for distributed teams: we made a bunch of usability tweaks to the notifications you get when coworkers make changes.
  • We have added more content to our website and generally improved its layout. Over the coming days we will be adding more tutorial videos, in addition to the one we already have on how to use Kerika’s unique real-time collaboration canvases.
  • And, speaking of the canvas, we have added some cool animation effects that will help you navigate when you have canvases nested inside each other!

Our thanks to everyone who has been giving us feedback!

Next up: Kerika will be available from the Google Apps Marketplace and the Chrome Web Store.


What works for small businesses: LinkedIn, not Twitter

A great article from the Wall Street Journal on which social media channels have the most potential to help small businesses: a survey they did resulted in just 3% picking Twitter as the most effective tool.

41% picked LinkedIn, 16% picked YouTube, and 14% picked Facebook. Google+ came in at 7%.

What works for small businesses when it comes to social media

This matches our own sense for what works, and doesn’t, although the 7% that Google+ grabbed seems surprisingly high. Is this because of the increasingly tight integration that Google is enforcing between their search engine results and your usage of Google+? We haven’t seen any benefits at all from our Google+ efforts, and remain frustrated that we still don’t have a custom URL like plus.google.com/kerika…


It seems older browsers simply won’t go away

Kerika uses a ton of Javascript, and by the word “ton”, we mean “well over a hundred thousand lines of Javascript”. It is one of the most sophisticated user interfaces ever developed for the browser, and it delivers a fantastic, real-time, desktop-like experience right inside the browser. And it does so on Internet Explorer, Safari, Chrome and Firefox.

The problem has always been with Internet Explorer: versions before IE9 have very poor support for Javascript and HTML5 in general. In years past Microsoft gave lip-service to the idea of supporting the (then-emerging) HTML5 standards, but their pre-IE9 versions did a very halfhearted job of supporting Web standards. Too many people at Microsoft were still fixated on the idea of maintaining a proprietary lock-in by encouraging their users to stick with the Microsoft-specific extensions that ran only on IE Server and the IE browsers. Things turned around only with IE9, spurred, no doubt, by the surprising inroads that were being made by Firefox and Chrome. Now, happily, the thinking at Microsoft has really come around to supporting Web standards!

Well, Kerika doesn’t run on pre-IE9 versions of Internet Explorer. This was a critical design decision we made when we first started coding in 2010, based on the assumption that IE9 — which was then in beta form but already looking reasonably robust — would be quickly launched and vigorously promoted by Microsoft, and as quickly adopted by the IE user base.

That doesn’t seem to have happened, at least not as far and as widely as we had hoped, and a call this afternoon with a user who was stumped trying to make Kerika work on his office PC, which still runs IE8, prompted us to look at NetApplications data on browser market share and adoption curves. The data are, frankly, dismal.

First of call, let’s look at overall browser market share, as of Dec 2012:

Browser market share on Dec 2012

Overall, Microsoft is in a position to say they are still the most common browser out there, but not by much: total market share for Internet Explorer, across all versions, is 54.77%. The following graph, however, really puzzles us: it suggests that browser market share hare remained essentially static for most of 2012, which doesn’t quite jive with anecdotal evidence we have been getting from users suggesting that Chrome is making surprising inroads among both Mac and Windows users:

Browser market share in 2012

Looking at specific versions of Internet Explorer shows some data that matches our intuition and general market understanding:

IE10 Market Share
IE10 Market Share

But there’s other data that are really puzzling: why would IE6’s market share rise in mid-2012? Were a bunch of old laptops suddenly taken out of storage and donated? No new machines could have come into the market with IE6, nor could many machines have downgraded to IE6 (unless everyone has been saving their installation disks for Windows XP and decided to collectively reinstall their desktop operating systems in July…)

Browser market share in 2012
IE6 Market Share
IE6 Market Share

Perhaps the data aren’t so reliable after all, although NetApplications has long been the most highly cited source for data on browser market share.

We need some of those curves to start bending soon…


A new Weekly Prioritization template, inspired by Jim Collins’s work

Jim Collins, acclaimed author of Build to Last and other well-received books, wrote an interesting blog post about 10 years ago on the importance of creating a Stop Doing list.

Mr. Collins emphasized the importance of deciding not to continue doing something any longer as key to successful prioritization:

A great piece of art is composed not just of what is in the final piece, but equally important, what is not. It is the discipline to discard what does not fit — to cut out what might have already cost days or even years of effort — that distinguishes the truly exceptional artist and marks the ideal piece of work, be it a symphony, a novel, a painting, a company or, most important of all, a life.

He cited the example of Darwin Smith of Kimberly-Clark making the critical decision to sell off the company’s paper-mills, which provided the bulk of the company’s revenues and had been in existence for 100 years (!), in order to focus on the new consumer business of paper towels.

This article has inspired us to create a new task board template called “Weekly Prioritization”: it lets you organize your work in a different way from the traditional “To Do / In Progress / Done” taxonomy of Kanban, by using columns organized as:

  • Must Do: in here, put everything that absolutely must get done that week.
  • Should Do: everything that you would really like to get done, once you get all the “must do’s” done.
  • Could Do: stuff you could do, if you had any time left
  • Stop Doing: this is the really critical column — identify everything that you should stop doing!

Let us know how useful this proves to you! (Hat tip to Eitan Nguyen for the suggestion…)

And, as usual, we will continue building new process templates to help our disparate users with their projects.

Coming up: a “unified inbox” view of all your projects

We should be wrapping up yet another new version of Kerika in the next few days: we have been focusing on how to make it easier for people to get to all of their projects, across all the accounts they are working in.

Some quick background: Kerika lets you create projects in your own account, of course, but also in the accounts of other people who have added you to their project teams. This means that over time you can end up creating, and working on, projects that are owned by several different accounts. Our users have asked for this to be improved in two ways:

  • Users want to make sure they are creating projects in the right accounts, so people want to get a little reminder of which account is being used, each time they create a new project.
  • Users want fast access to all of their projects, across all of their accounts.

Here’s what we are doing to help: first, make it clear to you which account is being used to create your new project. The dialog for creating a new project will look like this:

New Project dialog

So, right up front you can see the name of the account you will be creating your new project in, and the face of the account owner. If you want to create your project in a different account, you can switch right on this dialog with one easy action.

The second big change is to create what we call a “unified inbox” view of all your projects, similar to how email clients work that let you see all your emails in one place, across all your accounts.

When you are looking at your projects, the “My Projects” link will show you all your projects, across all your accounts:

Unified Inbox

Just below the “My Projects” link are all the accounts that you have access to, starting with your own (which is always called “My Account”), and followed by the accounts that have projects that were updated most recently. This makes it easier for you to access not just all your projects, but also the accounts that are most active.

This improvement, like everything else we have done, has been driven by valuable user feedback! Next up, once we get this version wrapped up, is simpler billing system and integration with the Google Apps Marketplace and the Google Chrome Web Store.

Coming up: a simpler pricing for Kerika

We are moving to a simpler pricing scheme for Kerika:

  • As before, you can start with a free Standard Account, which will let you have two other people work on your projects.
  • Once your team grows past that point, you can upgrade to a Professional Account, which we are offering at a simple rate of $10 per user, per month (billed annually).
  • Academic & Nonprofit users can still request free service, which will now allow for up to 10 free users per account.

Three key changes with our new pricing:

  • You won’t have to buy “packs of licenses” any more: you can buy just as many as you need.
  • The new rate is higher, but reflects the tremendous increase in functionality since our November release of task boards, Kanban boards and Scrum boards.
  • The refund policy is simpler: instead of changing the subscription end-date, you will simply get a refund for the unused portion of any Professional subscription that you had purchased.

Our new pricing will continue to be very competitive, with tremendous value for your money because:

  • There are no limits on the number of projects you can create within an account.
  • There are no limits on the number of cards that you add to a particular project board.
  • There are no limits on the files that you share as part of a card (the size of your Google Drive is entirely between you and Google.)

All of our competitors are offering very complicated pricing schemes that limit your freedom to create and reconfigure projects as needed. But not us.

And, as before, we will continue to use Google Checkout for our billing, which means we will never see or store your credit card information.

When prosecutorial misconduct lurches from farce to tragedy

Aaron Swartz didn’t have to be driven to suicide by the horrific prospect of spending decades of life in prison for the “crime” of publishing taxpayer-funded research. There’s a petition at the White House to fire Assistant US Attorney Steve Heymann, who proudly put out this press release on July 9, 2011 to pat himself in the back:

If convicted on these charges, SWARTZ faces up to 35 years in prison, to be followed by three years of supervised release, restitution, forfeiture and a fine of up to $1 million.

That’s 35 years in prison for publishing taxpayer-funded research — yes, that’s right: we are talking about research funded with your tax dollars. And the farce that’s wrapped up inside this tragedy is that JSTOR, which housed the research that Aaron downloaded, has already decided to make all these documents available free to the public.

When someone screws up this badly in the private sector, he is fired, fast, and deservedly so. Why not in the public sector as well?