Kerika helps you (and your team) manage multiple versions of a document, and it does this so smoothly that you might not even have noticed…
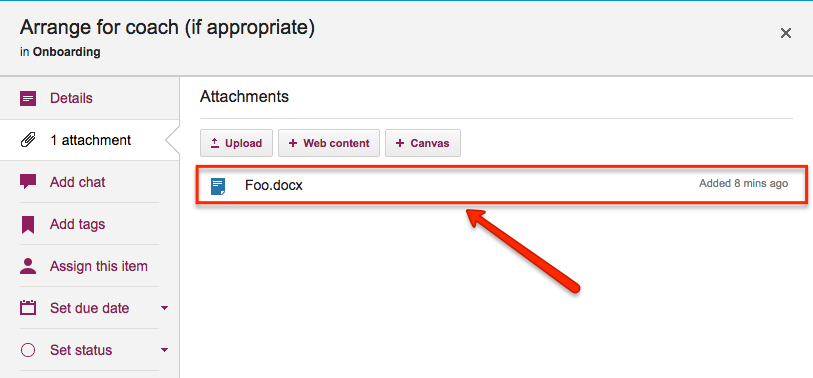
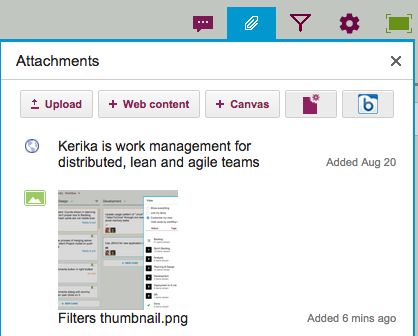
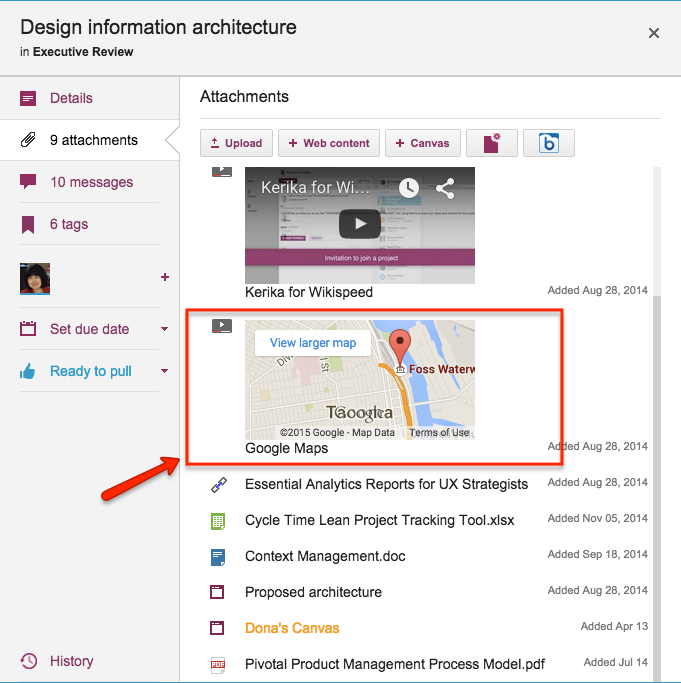
Here’s how it works: when you add a file to a Kerika card or canvas, it shows up in the list of attachments, like this:

If you then attach another file to the same card or canvas that has the same name and file type, Kerika automatically treats it as a new version of the same file, rather than a completely different file:
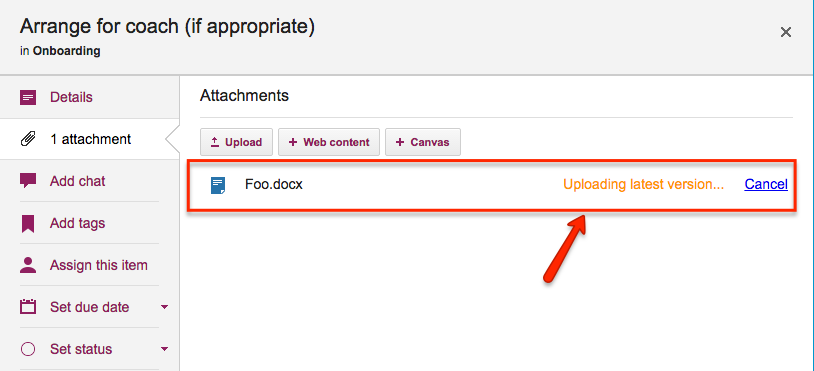
In the example above, when a Team Member adds another document called Foo.docx to a card that already has a file attached to it with the same name and file type, Kerika treats the new document as a new version of the old Foo.docx rather than as two documents called Foo.docx.
How you access all these old versions depends upon how you set up your Kerika account:
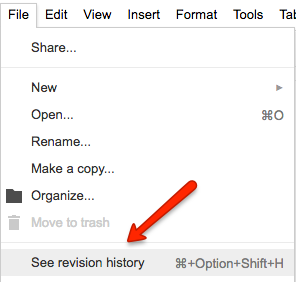
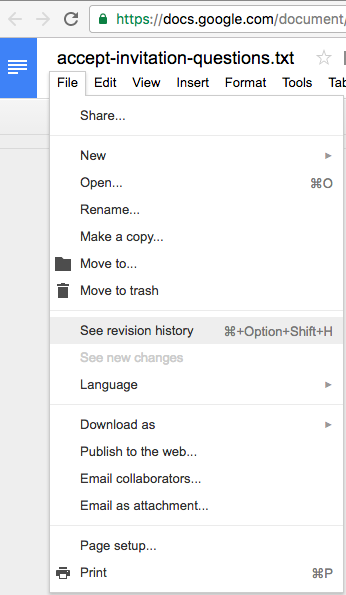
If you are using Kerika+Google, these files are being stored in your Google Drive, and Google will manage the versions for you: you can find this under the File menu in Google Docs
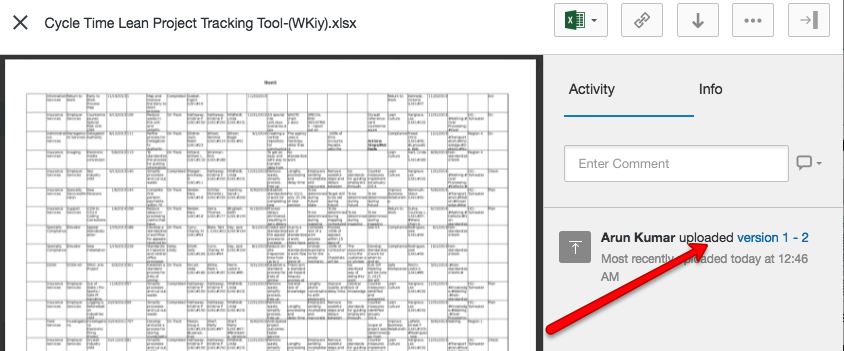
And pretty much the same thing is true if you are using Kerika+Box: Box will take care of the older versions automatically, although their user interface is slightly different
And what if you signed up directly with Kerika, without using a Google or Box ID?
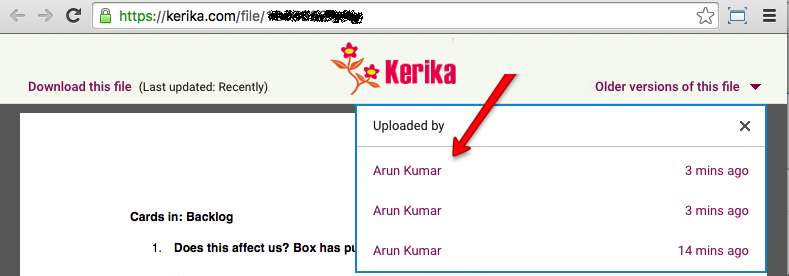
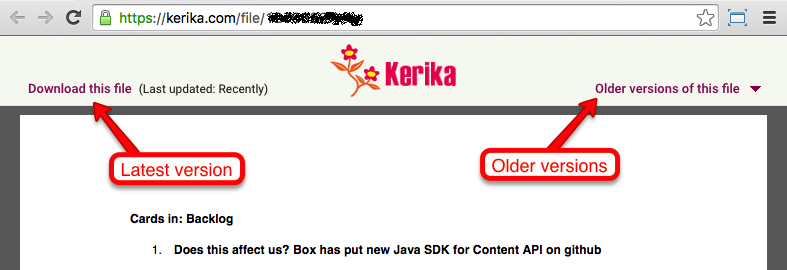
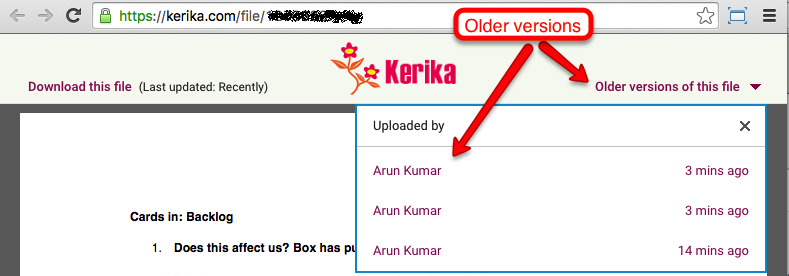
We provide an easy way to get to older versions of a file for users who signed up directly: when you are previewing a file, click on the Older versions of this file link on the top-right.
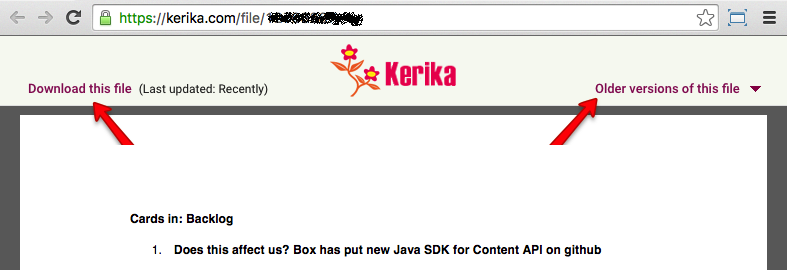
Kerika will show you a list of all the old versions that are available for that file, along with details on who uploaded those versions, and when: